How to download and install the IBKR Mobile app from alternative app stores
Background:
As a consequence of the US Government Huawei ban, the owners of Huawei smartphones will be no longer able to access the Google Play Store and download app from there. If you are affected by this constraint, you will still be able to download and install the IBKR Mobile app from an alternative app store.
Please proceed as follows:
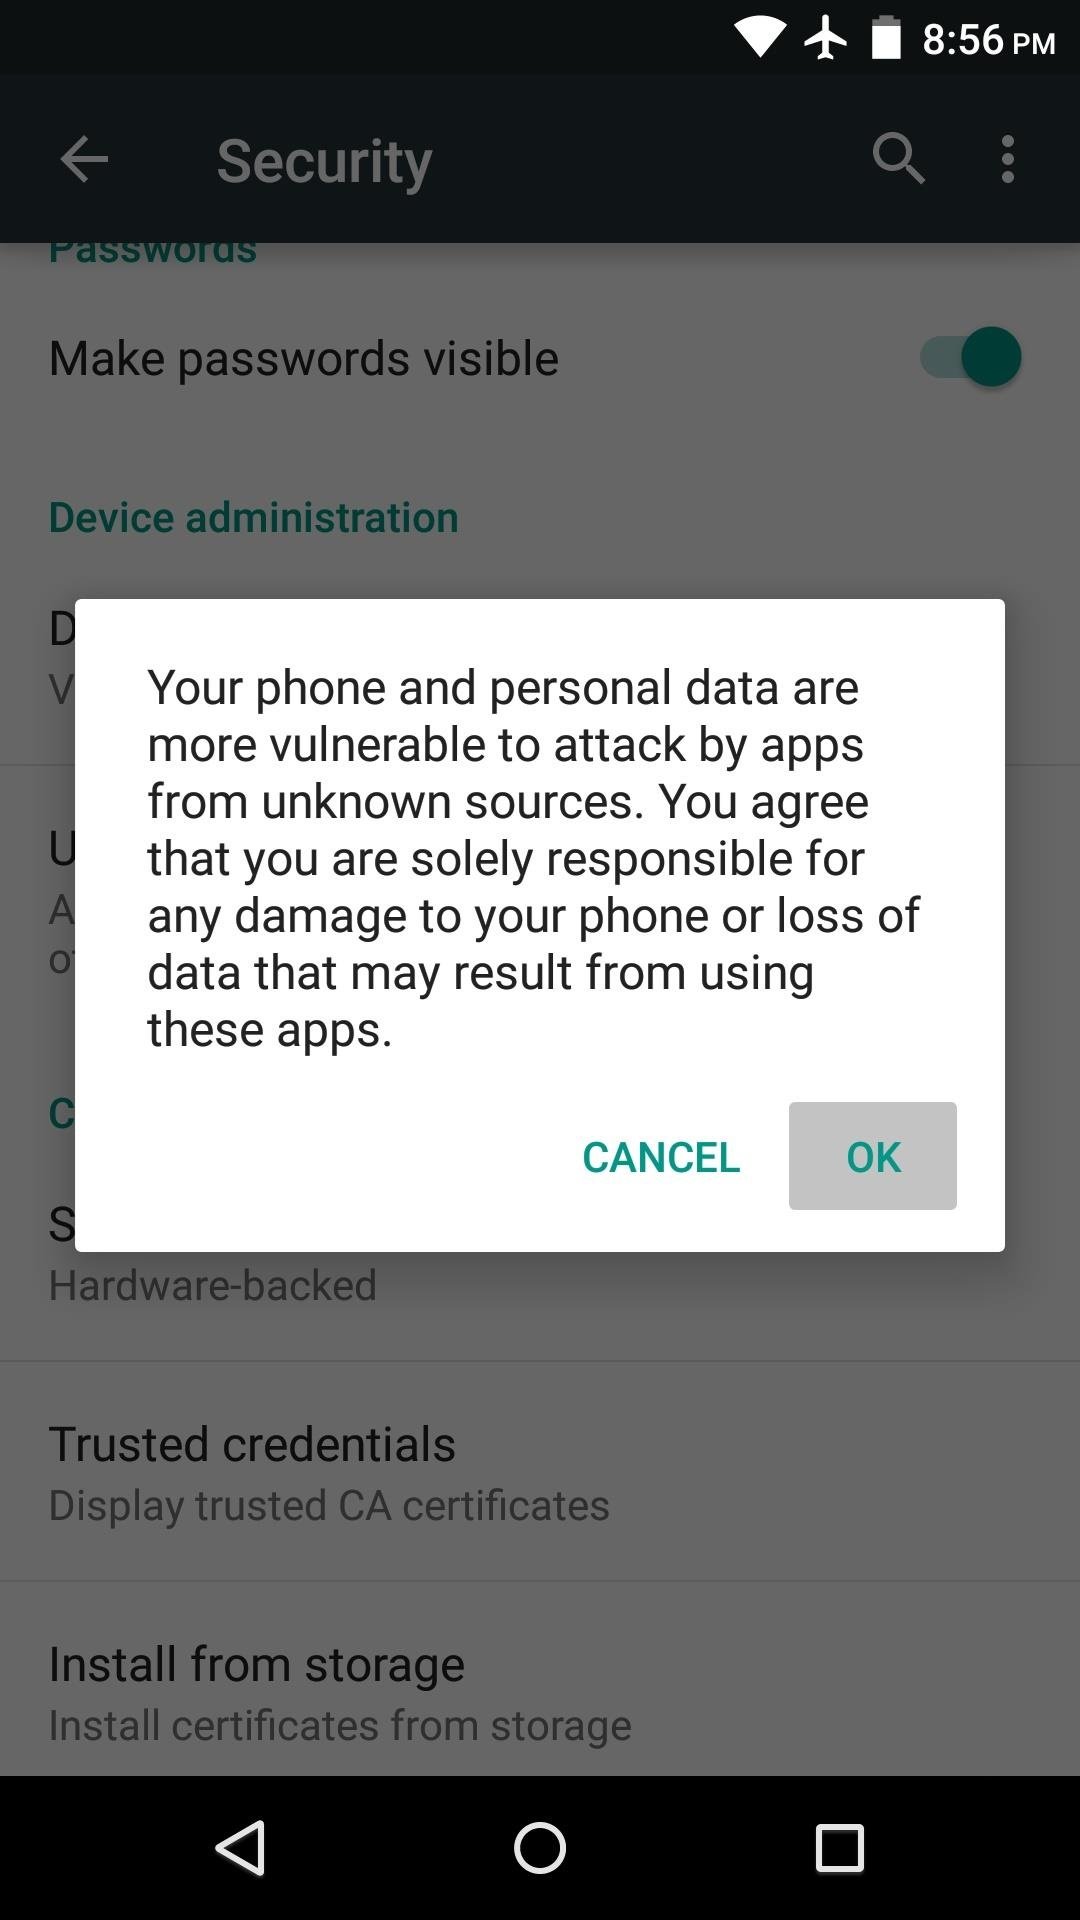
A) Allow your phone to install software from alternative app stores in this way:
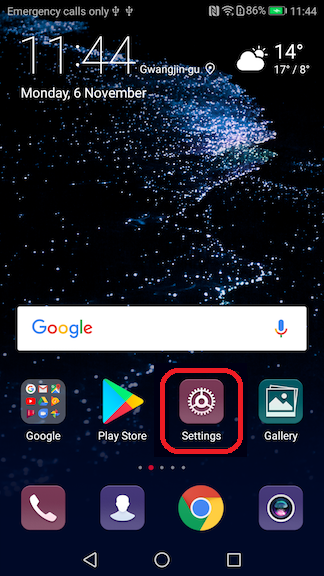
1) Go to your phone Settings
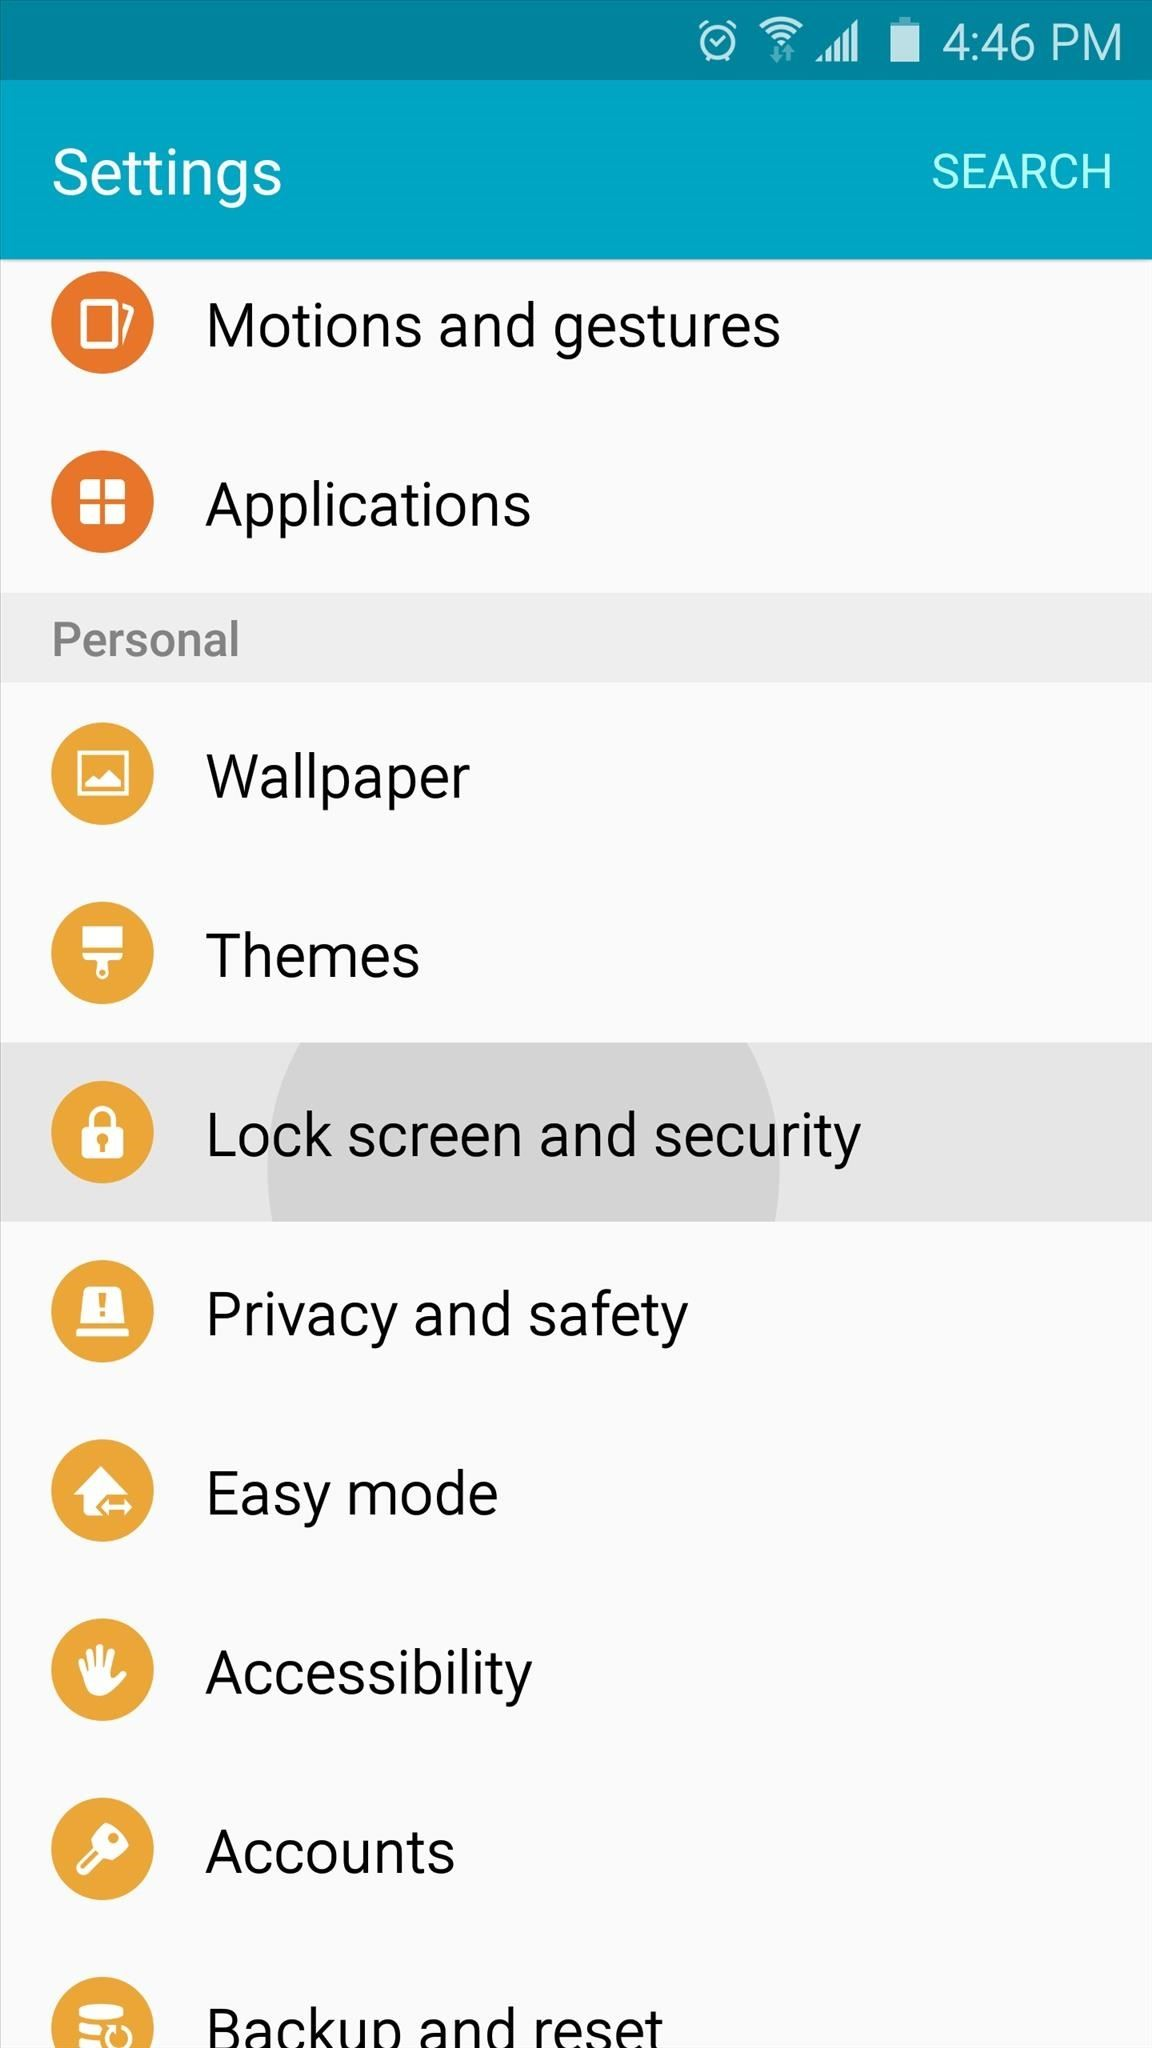
2) Under the section System you will find the item Security (it can be called Lock Screen and Security). Click on it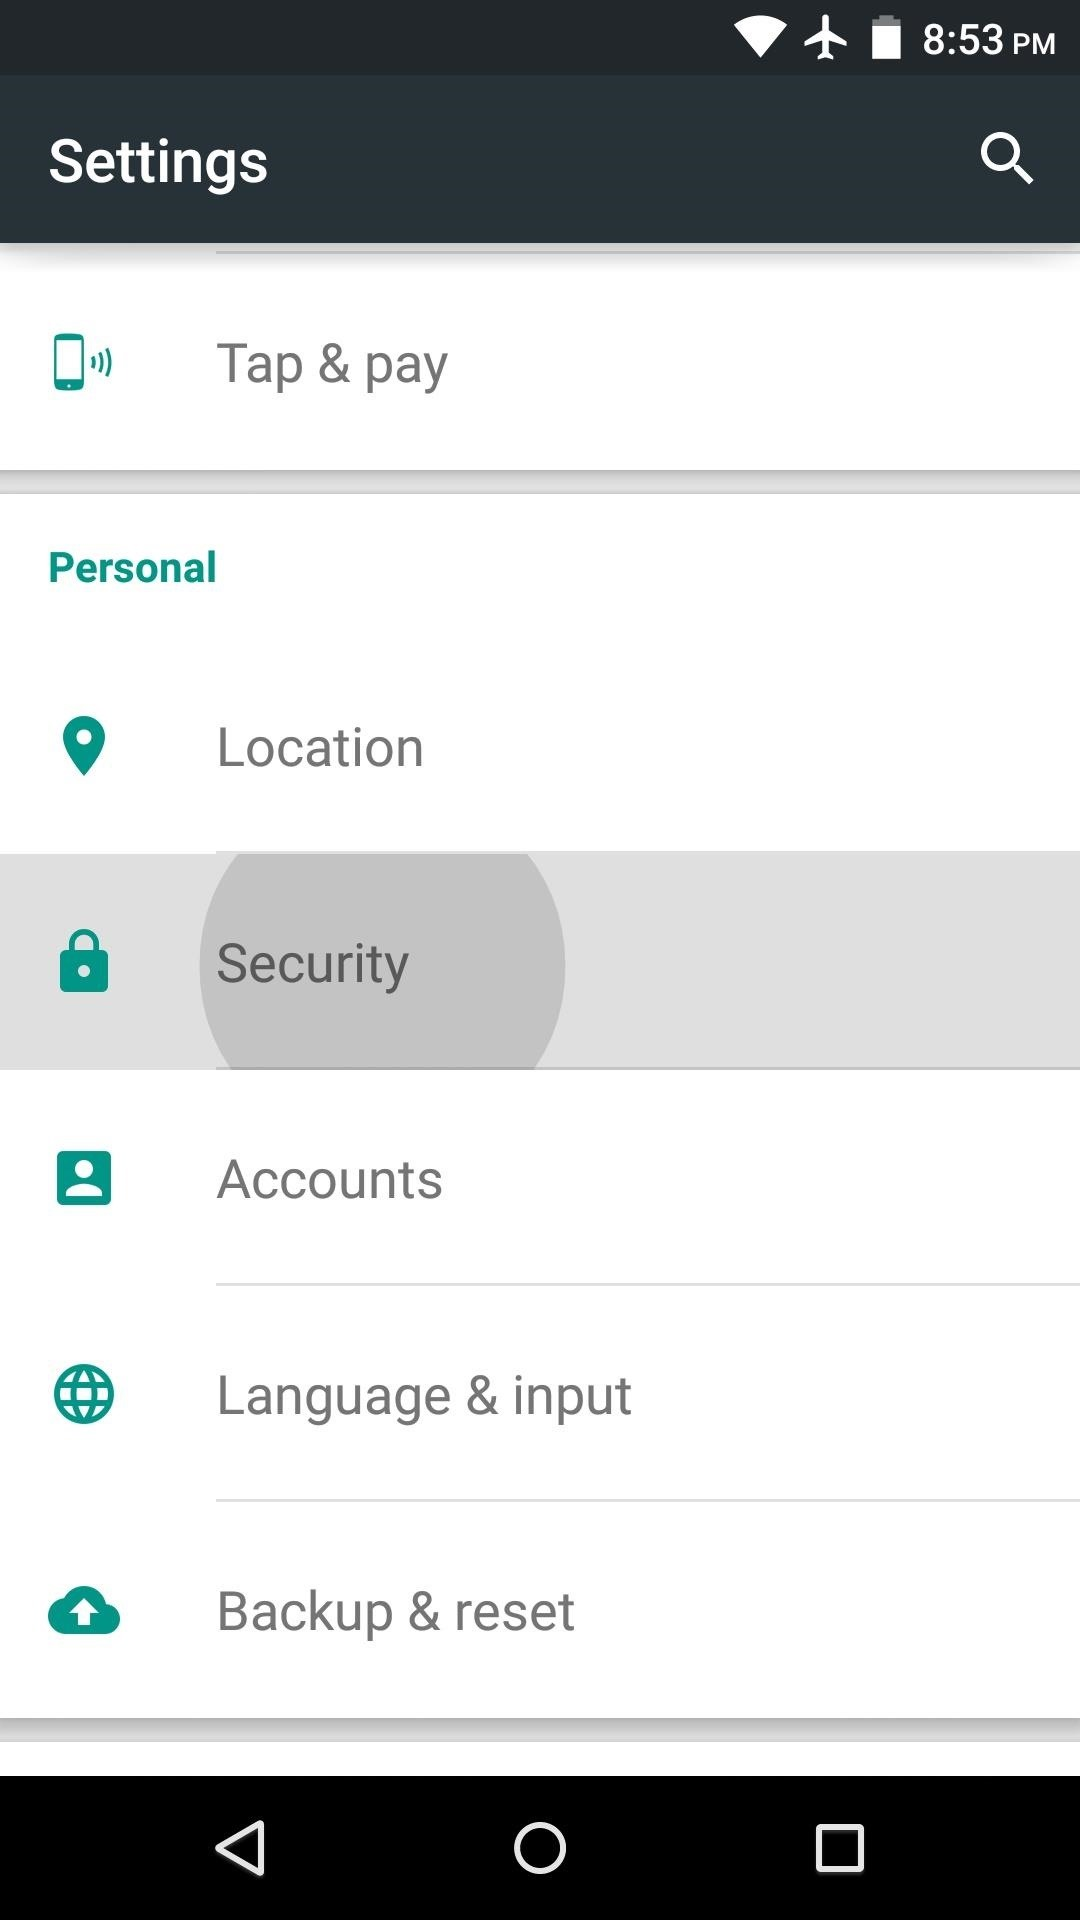
3) Tick the checkbox (or enable the switch) correspondent to Unknown sources
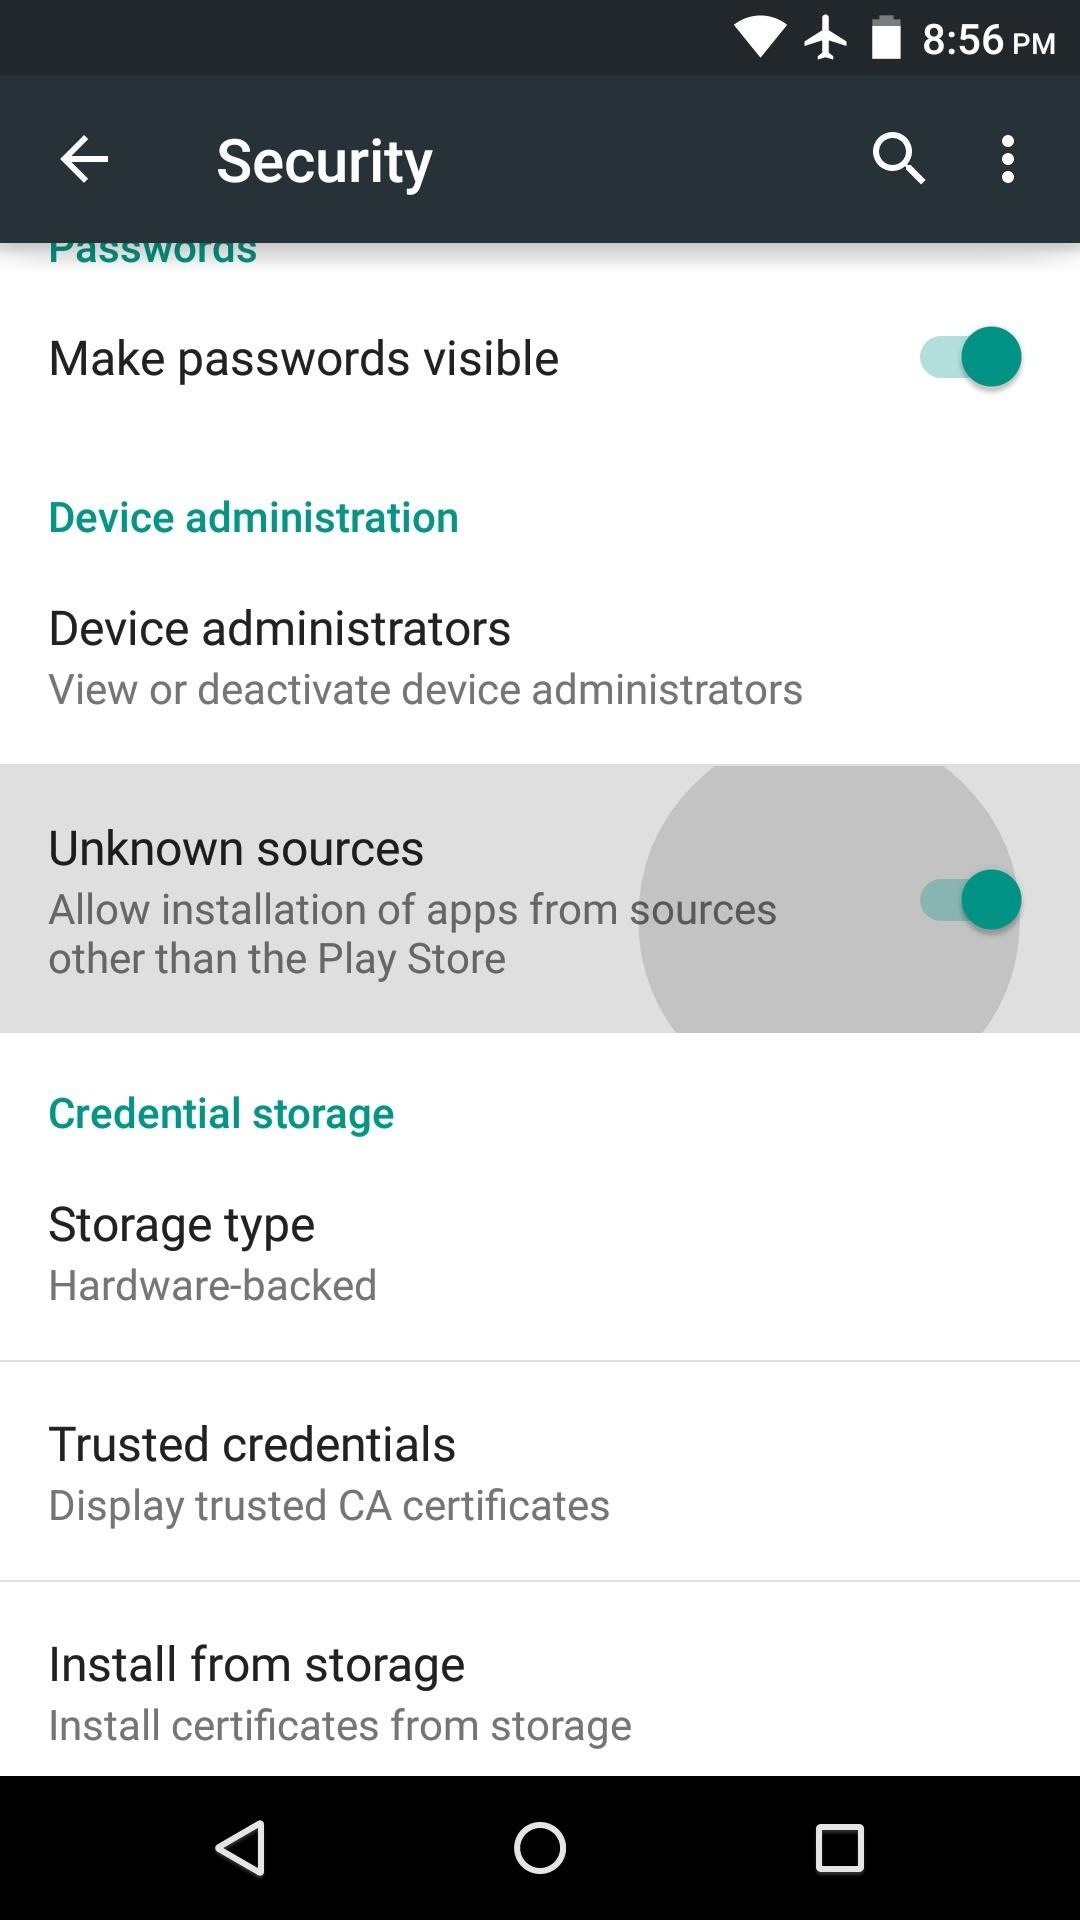
4) Should the system show you a warning message, aknowledge it by clicking OK
B) You can now download the IBKR Mobile by clicking on one of the links below, according to the alternative store you want to use:
360.cn
1) Click on the image below to open the IBKR Mobile download page:

2) Click on the green button on the right
.png)
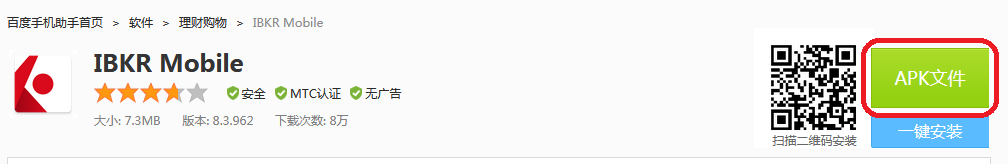
Baidu
1) Click on the image below to open the IBKR Mobile download page:
2) Click on the green button on the right
快照市场数据
背景
符合一定要求的IBKR客户可选择提交单次请求,要求接收某个金融产品的实时报价。该服务被称为“快照报价”。传统报价服务会持续更新实时报价,而快照报价不会,这是它与传统报价服务的不同之处。对于不经常交易且不希望根据延时报价1下单的客户,快照报价的价格更有竞争力。有关该报价服务的更多信息如下。
报价项目
快照报价包括以下数据:
- 最后价
- 最后价交易数量
- 最后价交易所
- 当前买价-卖价
- 当前买价-卖价的交易数量
- 当前买价-卖价的交易所
可用服务
| 服务 | 限制 | 每条报价请求的价格(美元)2 |
|---|---|---|
| AMEX(B/CTA网络) | $0.01 | |
| ASX Total | 不支持ASX24 仅限非专业订阅用户 |
$0.03 |
| Bolsa de Madrid | $0.03 | |
| 加拿大交易所集团(TSX/TSXV) | 仅限不是IB加拿大客户的非专业订阅用户 | $0.03 |
| CBOT实时 | $0.03 | |
| CME实时 | $0.03 | |
| COMEX实时 | $0.03 | |
| Eurex Core | 仅限非专业订阅用户 | $0.03 |
| Euronext基础版 | 仅限非专业订阅用户 包括Euronext股票、指数、股票衍生品及指数衍生品 |
$0.03 |
| 德国ETF和指数 | 仅限非专业订阅用户 | $0.03 |
| 香港(HKFE)衍生品 | $0.03 | |
| 香港证券交易所(股票、权证、债券) | $0.03 | |
| 约翰内斯堡证券交易所 | $0.03 | |
| 蒙特利尔衍生品 | 仅限非专业订阅用户 | $0.03 |
| NASDAQ(C/UTP网络) | $0.01 | |
| Nordic衍生品 | $0.03 | |
| Nordic股票 | $0.03 | |
| NYMEX实时 | $0.03 | |
| NYSE(A/CTA网络) | $0.01 | |
| OPRA(美国期权交易所) | $0.03 | |
| 上交所5秒快照(通过HKEx) | $0.03 | |
| 深交所5秒快照(通过HKEx) | $0.03 | |
| SIX瑞士交易所 | 仅限非专业订阅用户 | $0.03 |
| 即期市场德国(Frankfurt/Xetra) | 仅限非专业订阅用户 | $0.03 |
| STOXX指数实时数据 | 仅限非专业订阅用户 | $0.03 |
| 多伦多证券交易所 | 仅限IB加拿大客户中的非专业订阅用户 | $0.03 |
| 多伦多证券交易所创业板 | 仅限IB加拿大客户中的非专业订阅用户 | $0.03 |
| 英国伦敦证券交易所(IOB)股票 | $0.03 | |
| 英国伦敦证券交易所股票 | $0.03 |
1根据监管要求,IBKR不再向Interactive Brokers LLC的客户提供美国股票的延时报价信息。
2费用按每笔快照报价请求计算,如果不是美元计费,则将按账户基础货币收取。
资格要求
- 账户必须达到市场数据订阅的最低和维持资产要求才能使用快照报价服务。
- 用户必须运行TWS 976.0或以上版本才能使用快照报价功能。
定价详情
- 每月客户可免费接收$1.00美元的快照报价。免费快照可能会用于美国或非美国报价请求,而一旦免费额度用完,便会直接开始收费,不再另行通知。客户可在客户端中查看其每日的快照使用情况。
- 报价采用后付费模式,通常在提供快照服务次月的第一周收取。账户现金或含贷款价值的净资产如不足以支付月费的,账户持仓将面临清算。
- 快照数据的月费用不得超过相关实时数据的月费。如果当月快照报价合计费用达到了相关实时数据的价格,则该月剩余时间用户无需支付额外费用便可使用实时数据服务。系统将在用户达到快照数据费用上限下一个工作日的美东时间18:30左右切换为实时报价。月末,实时报价服务会自动终止,次月快照费用则重新开始累计。每项服务的费用均单独累计,一项服务的报价请求不得与另一项服务合并来应用上限。详情请见以下表格。
| 服务 | 每条报价请求的价格(美元) | 非专业订阅用户上限(请求次数/总费用)2 | 专业订阅用户上限(请求次数/总费用)3 |
|---|---|---|---|
| AMEX(B/CTA网络) | $0.01 | 150/$1.50 | 2,300/$23.00 |
| NASDAQ(C/UTP网络) | $0.01 | 150/$1.50 | 2,500/$25.00 |
| NYSE(A/CTA网络) | $0.01 | 150/$1.50 | 4,500/$45.00 |
请求快照报价
桌面版交易——标准模式TWS:
如您已能看到延时数据且启用了快照报价,则您可在“代码行动”栏下看到“快照”按钮:

点击“快照”按钮后会出现报价详情窗口。一旦系统收到了该产品的NBBO(全国最佳买卖价)报价,报价详情窗口会即刻生成一个时间戳并显示NBBO信息:

在报价详情窗口中点击刷新链接会更新NBBO报价。
举例:
在上例中,GOOG是一家在纳斯达克(C/UTP 网络)上市的公司。每请求一次报价(一次快照)的费用为0.01美元。
- 非专业用户最多可再请求149条GOOG或任意其它在纳斯达克(C/UTP 网络)挂牌的股票的快照数据,超过149条将切换为实时报价。
- 专业用户最多可再请求2449条GOOG或任意其它在纳斯达克(C/UTP 网络)上市的股票的快照数据,超过2449条将切换为实时报价。
您请求快照数据产生的费用不会超过上限。一旦达到上限,该月剩余时间将不会产生新的费用,且您将收到该产品的实时数据。
桌面版交易——TWS魔方:
如您已能看到延时数据且启用了快照报价,选择监控标签下的某一行后,“定单输入”窗口会显示请求快照数据的选项。

点击+快照链接后会出现报价详情窗口。一旦系统收到了该产品的NBBO报价,报价详情窗口会即刻生成一个时间戳并显示NBBO信息:

在报价详情窗口中点击刷新链接会更新NBBO报价。
客户端:
如您已能看到延时数据且启用了快照报价,在买价/卖价下的“定单委托单”窗口内,您将看到快照链接:

点击快照链接后会出现报价详情窗口。一旦系统收到了该产品的NBBO报价,报价详情窗口会即刻生成一个时间戳:

在报价详情窗口中点击刷新链接会更新NBBO报价。
网络交易——网络交易者(WebTrader):
如您已能看到延时数据且启用了快照报价,在“市场”标签下的“其它数据”栏上您将看到“快照”数据:

点击“快照”按钮后会出现报价详情窗口。一旦系统收到了该产品的NBBO报价,报价详情窗口会即刻生成一个时间戳:

移动交易——移动IBKR应用:
在报价界面点击任意产品代码会扩展报价框。如您已能看到延时数据且启用了快照报价,您将看到“快照”链接:

点击“快照”链接后会出现报价详情窗口。一旦系统收到了该产品的NBBO(全国最佳买卖价)报价,报价详情窗口会即刻生成一个时间戳并显示NBBO信息:

Why do I receive a message stating market data is over the limit?
Background:
When you open an account with IBKR, you are initially set to receive a minimum of 100 concurrent lines of market data. This means that, either on IBKR Trading Platforms (TWS, IBKR Mobile, Client Portal trading facility) or on API/third party interface, you can simultaneously feed 100 tickers with market data. As explained here, after the first month of trading, your allowance might be increased either automatically (based on your account equity/commission) or manually (by the purchase of Quote Booster packs.)
Note: The same market data allowance is set for all the users of the same account, since it is based on account-wise parameters such as commissions and equities.
Table of contents
Why some financial instruments show question marks instead of data?
There are various functions and tools in TWS using market data: watchlists, charts, trading or analytical tools, alarms. In general, any foreground window which actively uses market data for display or for calculations, will increase the total number of market data channels currently opened. Once you have exceeded the maximum Market Data allowance for your account, you will be prevented from receiving additional market data. In this case, one or more tickers will show a "?" instead of actual quotes and your TWS will display the following warning message:
"You have requested data for XXX contracts simultaneously, which exceeds your account current limit of YYY. You may increase your limit by subscribing to market data Booster Packs."
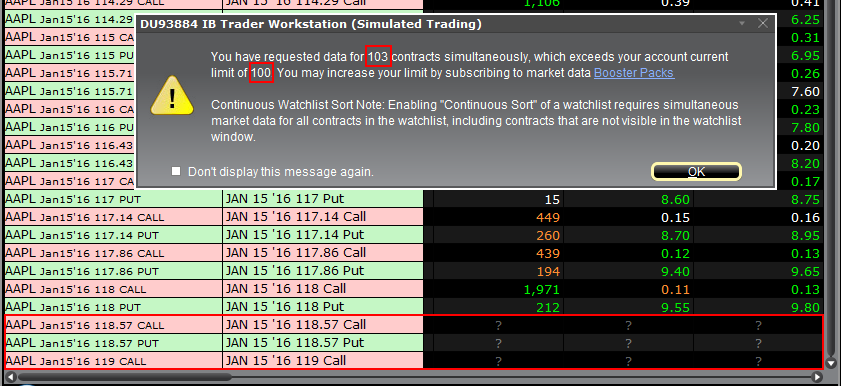
Note: If you have decided to hide the warning by ticking the checkbox "Don't display this message again", you will not see it again next times you exceed the market data limit. Nevertheless you will still see "?" for one or more tickers instead of the actual quotes.
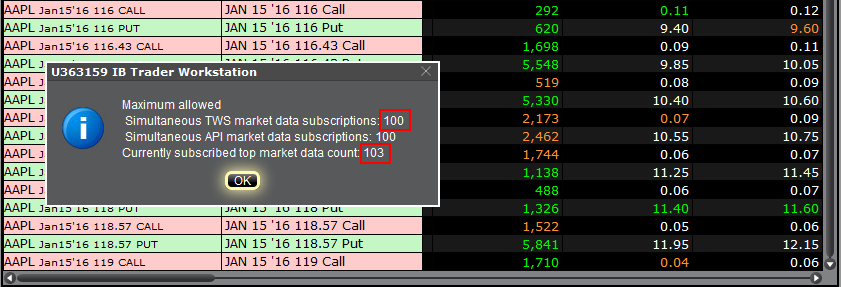
Where can I check the current market data allowance?
Within TWS, you can check how much of your total market data allowance you are currently consuming in the "Maximum Allowed" window. While in TWS, press the keys Ctrl + Alt + = (on a MAC click: Control + Option + =) and you will see the Maximum allowed pop-up indicating the market data allowance (the value close to "Simultaneous TWS market data subscriptions") and the market data lines currently used (the value close to "Currently subscribed top market data count".)
Which solutions are available to me?
-
Reduce the number of financial instruments displayed within your trading platform
To overcome an excessive market data usage, the easiest solution is to reduce the amount of financial instruments present within your trading platform. Here below are some ways to accomplish that:
a. Delete some tickers from your watchlist(s). There might be old tickers you are no longer interested in or there may be expired contracts. Deleting those will reduce the overall market data usage.
b. Minimize or hide one or more watchlist or other tools consuming market data. Only the TWS windows which are active and in the foreground contribute to market data count. If you have floating watchlists/charts and you minimize them or send them to the background, you will actually decrease the overall market data usage by the number of tickers present on those watchlists/charts
c. Use more restrictive filters within Option Trader / Option Chains / Strategy Builder. Those tools often become top market data consumers due to the high number of option contracts they display. All those tools provide filtering based on strike / expiry / trading class. By acting on those filters you can reduce the number of option contracts displayed
Note: Some derivatives contracts (Futures, Options, Future Options) will often consume two market data channel, one for the contract himself and one for the underlying, since the underlying contract is used for Greeks / Volatility calculations
-
Purchase Quote Booster pack(s)
Each Quote Booster pack will cost you 30 USD monthly and will entitle you to 100 additional market data lines (on the top of your current allotment). The maximum number of Quote Booster packs you can purchase for your account is 10.
How to fix the "Cannot create ... file" error during TWS installation on MacOS
Background:
The filesystem permissions are controlled by your machines operating system. One of their functions is to secure your files, preventing unauthorized access or undesired modifications to the system and to your personal data.
Some software on your computer may modify or override the permissions assigned by the operating system. Under certain circumstances, this prevents the TWS installer from accessing the folder where the application core files have to be created (/users/youruser/home/Applications). In such cases, the TWS installation usually displays the error "Cannot create ... file. Shall I try again?"
In this article we explain how to reset the filesystem permission of the "Applications" folder located under your user home folder in order to allow a smooth run of the TWS installation.
Procedure:
1. On your keyboard, press ⌘CMD + ⇧Shift +H to open your home folder
Figure 1

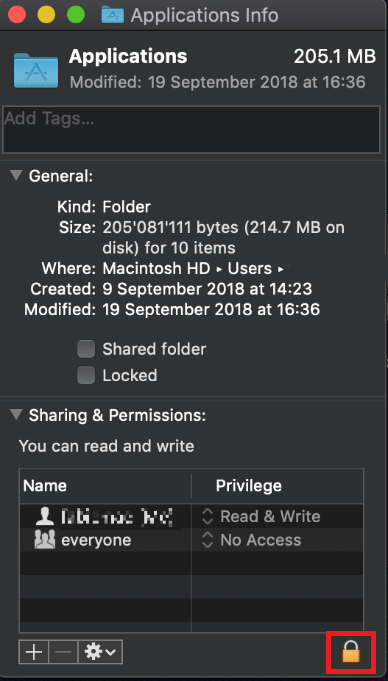
2. Select the folder "Applications" within your home folder and press ⌘CMD + I to open the Info panel
Figure 2

2. At the bottom right of the panel, click on the padlock
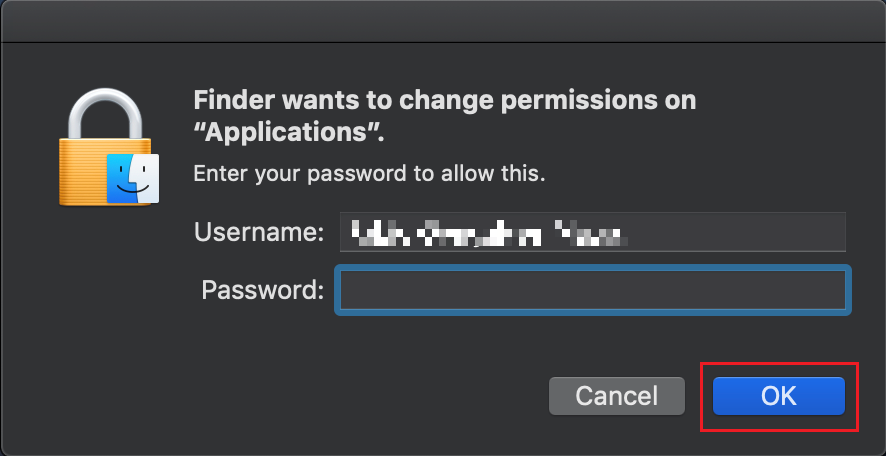
Figure 3
3. To unlock the permissions panel, enter your MacOS credentials and click OK
Figure 4
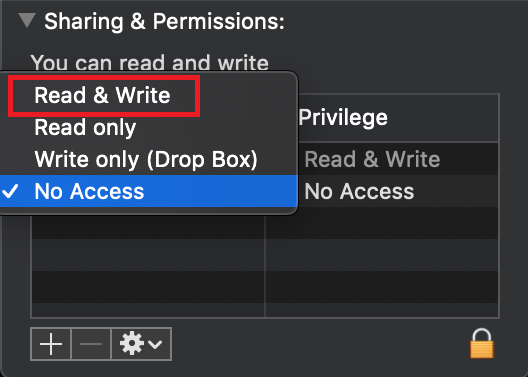
4. In the line correspondent to "everyone", click on "No Access" (Figure 5) and then select "Read & Write" (Figure 6)
Figure 5 Figure 6
.png)
5. Click on the icon bellow the permissions panel and select “Apply to enclosed items..."
Figure 7
.png)
6. Now run the TWS installer and click on Next> until you complete the installation
Figure 8
.png)
7. Once the installation has completed successfully, repeat the previous steps from 1. to 5. setting back the permissions of “everyone” to “Read Only” to revert your changes to the initial status
Complex Position Size
For complex, multi-leg options positions comprising two or more legs, TWS might not track all changes to this position, e.g. a vertical spread where the short leg is assigned and the user re-writes the same leg the next day, or if the user creates a the position over multiple trades, or if the order is not filled as a native combination at the exchange.
If you received a message because you are submitting an order to close a position, roll a position, or modify a position using the “% Change” feature, it means that the maximum quantity of option positions in your account that are available to close for this order is different from that of the original position tracked by TWS.
Before submitting, you should review the order and confirm that the order quantity we have calculated is the correct quantity that you want to trade.
IB TWS和IB Key整合为移动IBKR
概况
如何迁移账户使用者取决于您当前使用何种应用程序:
1. 您的智能手机仅用于交易(安装了IB TWS)- 点击此处
2. 您的智能手机仅用于验证(安装了IB Key) - 点击此处
3. 您的智能手机既用于交易,也用于验证(安装了IB TWS和IB Key) - 点击此处
4. 您的智能手机用于进行借记卡交易(安装了IB Key) - 点击此处
您是IB TWS用户
您使用手机上的IB TWS交易,但您未使用IB Key。
1. 在首次打开应用程序时,您将看到以下新的主页面。
图1是iOS设备上的移动IBKR主页面。图2是安卓设备的版本。
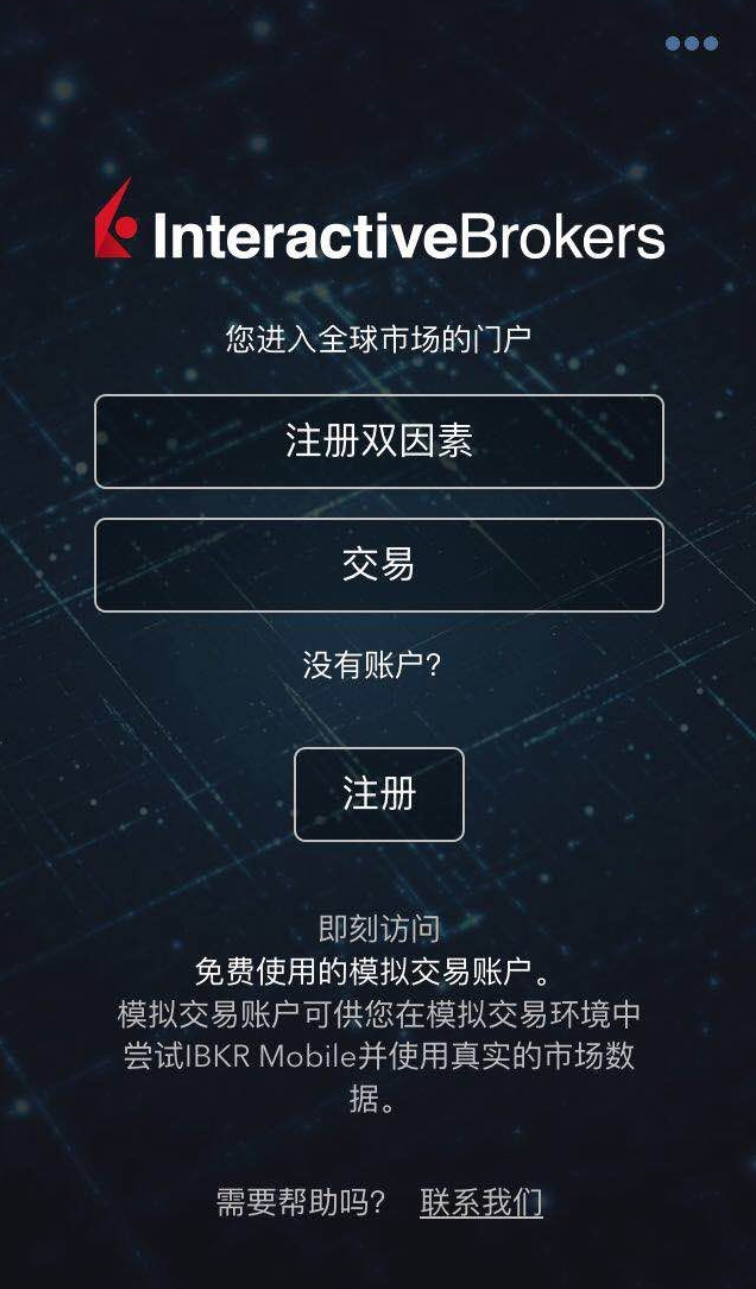
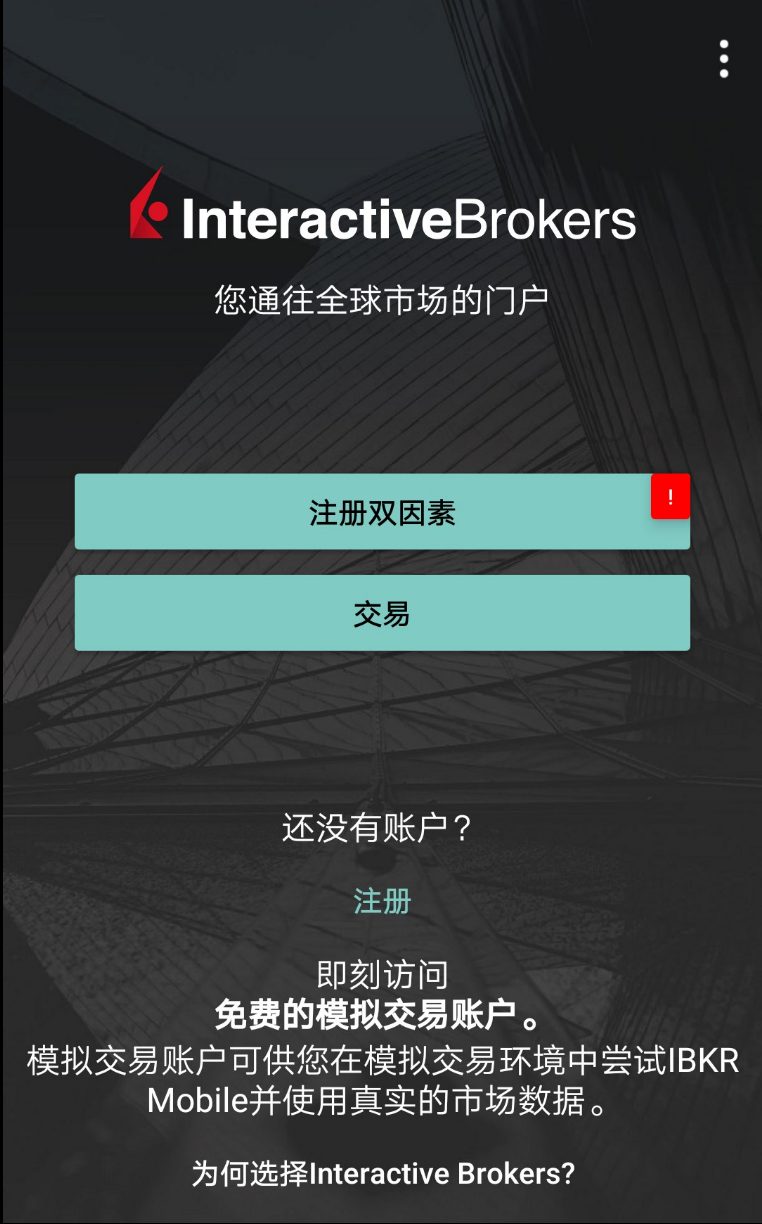
图1 图2
2. 点击“交易”按钮。
3. 应用程序的其它方面与您之前使用的一样。
通过“交易”页面访问其它功能
如您希望使用移动IBKR的其它功能,比如验证模块或借记卡功能:
对于iOS设备(图3)
1. 打开菜单上的“更多”(页面右下角)。
2. 滚动到页面底部。
对于安卓设备(图4)
1. 打开“应用”菜单
2. 滚动到底部的App设置
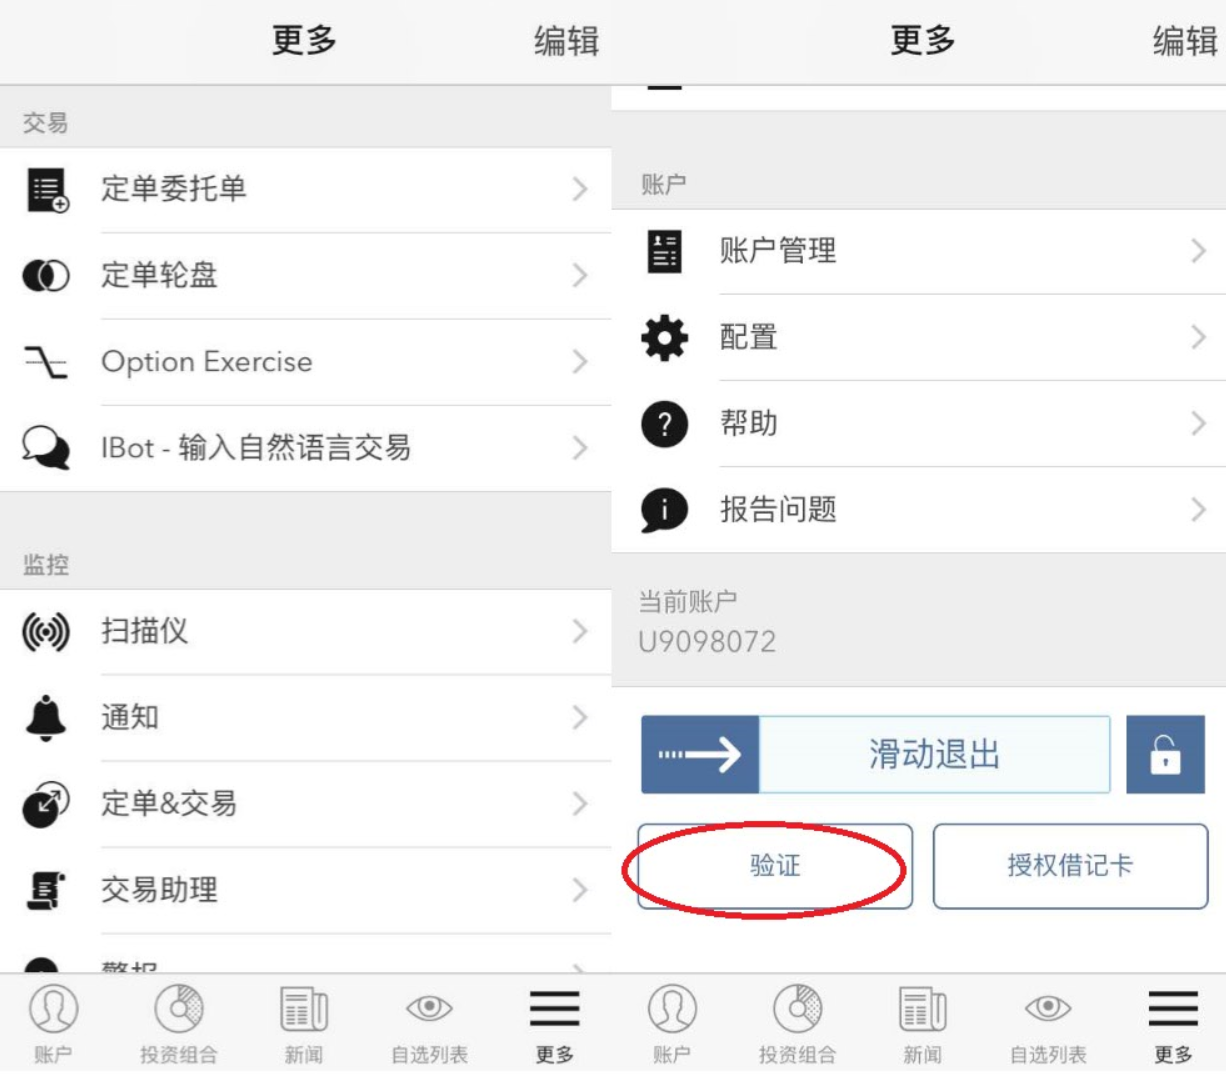
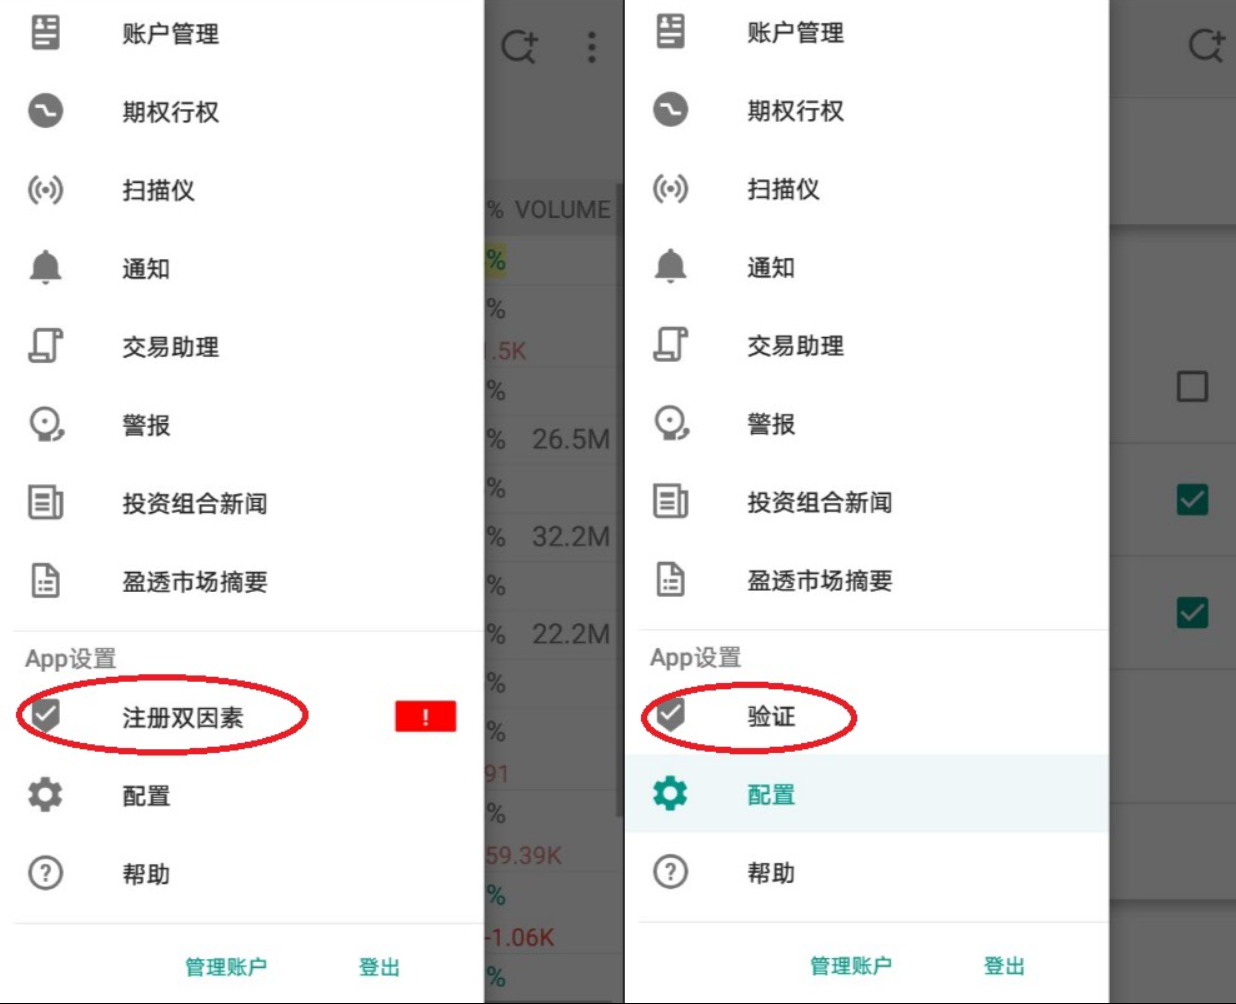
图3 图4
您是IB Key使用者
激活
1. 打开移动IBKR并点击“验证”。
2. 应用程序会检测设备上是否安装了IB Key并提示您下一步如何操作 - 要么自动迁移(图5),要么先更新、然后再自动迁移。
您也可选择之后再手动迁移。
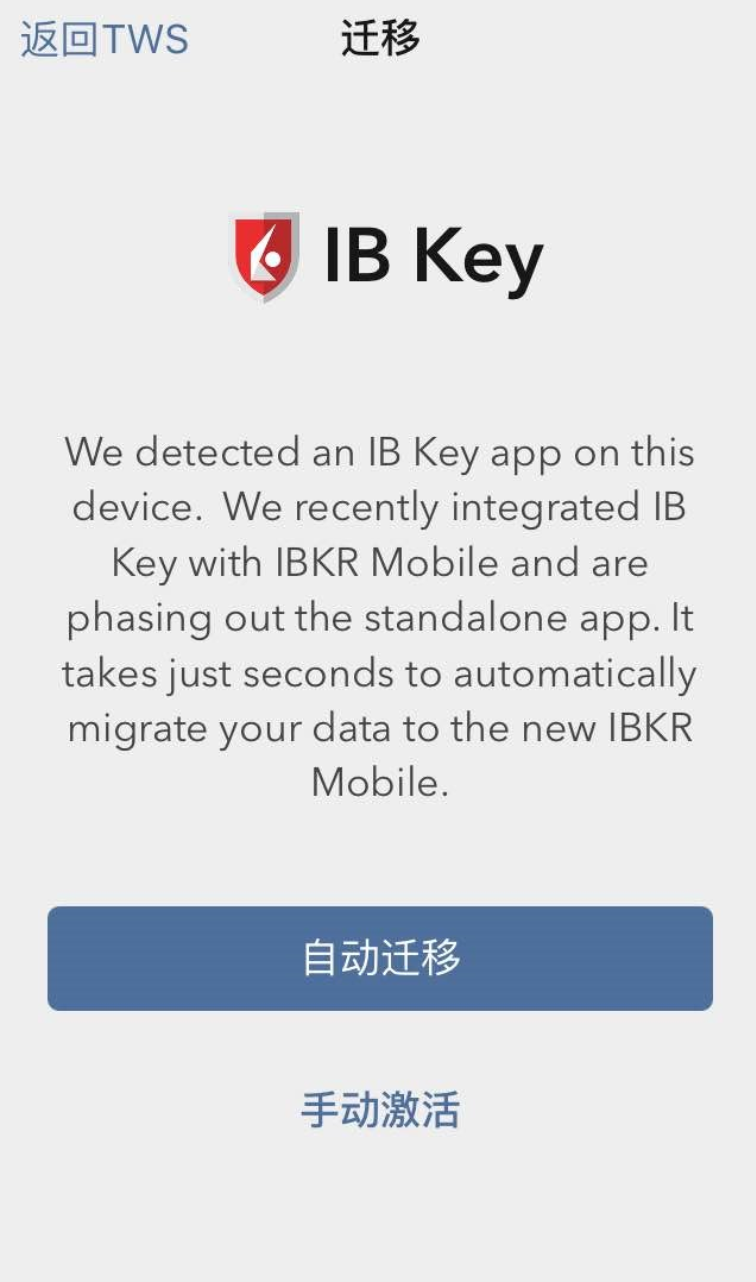

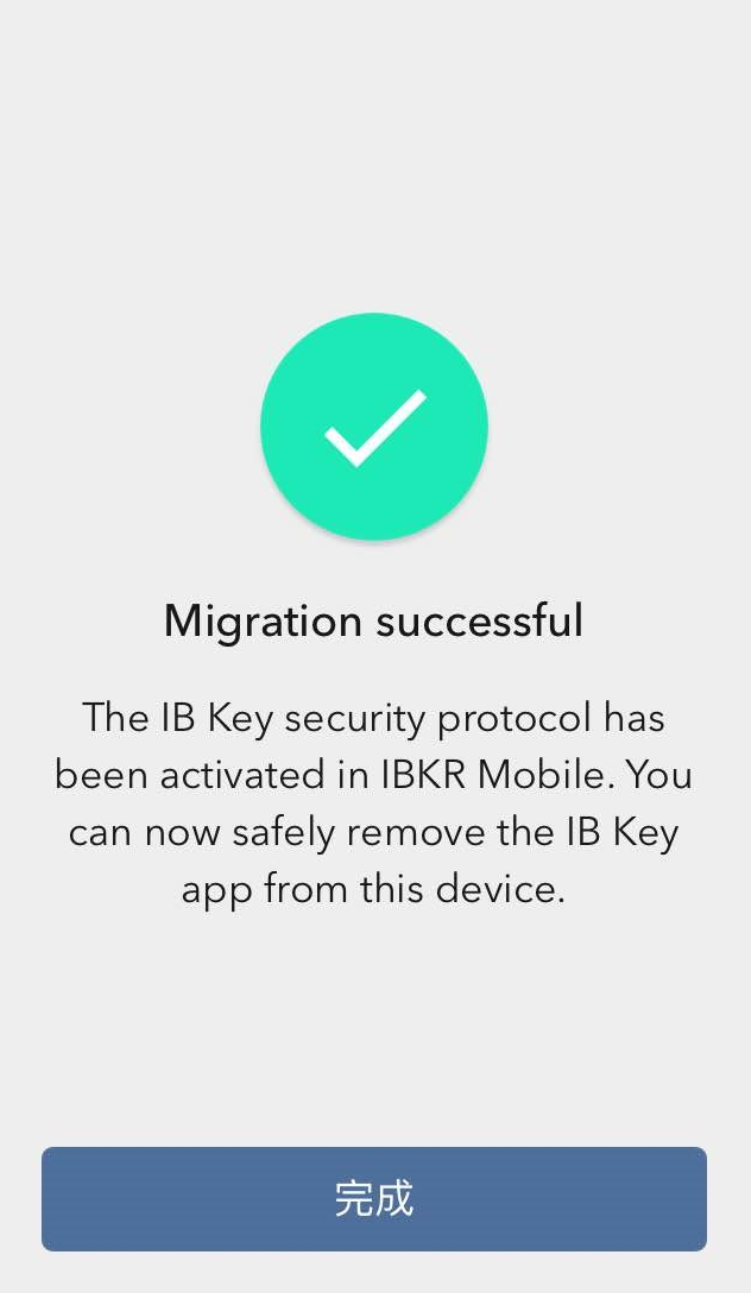
图5 图6 图7
迁移完成后,如您尝试运行独立的IB Key应用 - 即您之前验证过的IB Key - 您将看到以下界面(图8)。
.png)
图8
日常操作
A. 如您有网络连接,则日常登录没有任何变化 - 系统会使用无缝验证:
1. 在(TWS、账户管理、网页交易者或移动IBKR)的相应区域内输入您的登录信息。点击“登录”。
2. 系统会向您的手机发送一条通知 - 点击该通知。
3. 取决于您的设备,(在iOS设备上)将面部置于摄像头前或在指纹传感器上按压指纹,或(在安卓设备上)输入您的PIN码。系统会自动登录。
B. 如您没有互联网连接,您可通过验证-响应的模式使用移动IBKR:
1. 在(TWS、账户管理、网页交易者或移动IBKR)的相应区域内输入您的登录信息。点击“登录”。
2. 点击“我没有收到通知”。
3. 打开移动IBKR并点击“验证”。
4. 在您手机的“验证码”区域输入登录界面上显示的值。点击“生成”按钮。
5. 在登录界面的“响应字符串”区域输入您智能手机应用显示的值。点击“登录”。
您既是IB TWS的使用者,也是IB Key的使用者
1. 请先激活移动IBKR程序的“验证”模块(点击此处)。
2. 点击您新的移动IBKR应用主页面上的“交易”按钮登录交易界面(点击此处)。
您使用IB借记卡
1. 请先激活移动IBKR程序的“验证”模块(点击此处)。
2. 在移动IBKR应用的主页面上点击“借记卡”按钮。其它功能的使用和过去一样。
How to overcome the "Downloading settings from server failed" error
Background:
Store settings on server allows clients the ability to store their Trader Workstation (TWS) settings/configuration on the cloud and retrieve them at anytime from another computer. This feature allows you to use the layout of a specific user on two or more machines.
In some specific circumstances, the operation which stores/downloads the settings to/from the cloud may fail and the following error message may appear shortly after the TWS has loaded on the screen:
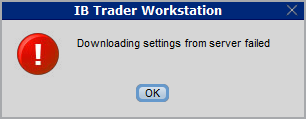
How to overcome this error message?
The underlying causes of this message are usually the following:
- ACCESS TO THE LOCAL MACHINE IS BLOCKED: A security setup, such as a firewall or antivirus, prevents the access of this computer to the cloud storage. This prevents TWS from accessing the remote server, thus disallowing the settings file upload or download. Recommended workaround: set up an exception on the firewall or antivirus in order to exclude the TWS executable file (c:\Jts\tws.exe) or the entire TWS folder (C:\Jts) from the real time security scan. The procedure to set an exclusion may vary, according to the software you are using, therefore we recommend consulting the user guide or the on-line documentation of your specific security program.
- ACCESS TO THE REMOTE SERVER IS BLOCKED: A firewall or proxy service blocks the communication with the cloud storage through the network on which this computer is. In this scenario, you (or your IT / Networking departments, in case you do not have the rights for such an operation) can modify the firewall or proxy settings to allow the computer to communicate with the cloud server s3.amazonaws.com on the TCP port 443. For additional details about the hosts/ports which needs to be allowed for the proper TWS operation, please see as well the section "DESKTOP TWS" of KB2816. Please refer to the documentation of your specific software in order to create specific rules for your firewall or proxy system.
See KB2323 for instructions on how to restore TWS settings from external storage
See KB2320 for instructions on transferring settings from one user to another
Why is my chart delayed, showing question marks or only partially populated?
Background:
What are SMART Charts and how are they generated?
The SMART charting mechanism analyzes and compares the market data coming from all venues a given contract is traded on and graphically displays the most favorable quotes.
When all the data streams are live, the data points are available for all sources and for each time point, thus they can be fully compared. The resulting SMART chart will be up to date and fully populated, moreover it will constantly and automatically update1.
The comparison between non synchronized market data streams (some live and some delayed) is just partially possible, since the delayed feeds are lacking data points for the last 15 or 20 minutes. Therefore, within that time frame, the SMART chart will usually display a series of yellow question marks to indicate unavailability of source data. In this case the SMART Chart will not update automatically.
When the lack of data points is more extensive or when the Exchange does not distribute delayed data for a given contract, the correspondent SMART Chart may be completely blank.
What should I do to obtain a fully populated, up-to-date chart?
If your trading method is based on SMART charts, you would need to activate the live market data subscriptions for all the marketplaces your financial instruments are traded on2. For additional details, please see KB1201
If your trading method does not require SMART charts, you can decide to use Direct chart routing as a workaround.
A Directed Chart will allow you to graphically represent the market data coming from a single, specific Exchange. When possible, we suggest to select the primary marketplace for the product for this purpose, since this is usually the one offering the highest liquidity and trade volume, hence normally providing the most favorable quotes. If you have subscribed the market data for that venue, the resulting Directed Chart will be fully populated, up to date and it will update automatically1.
How do I set up a Directed Chart?
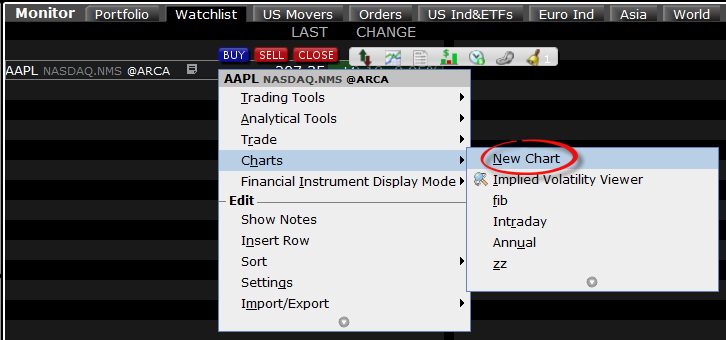
1. Within a watchlist, type the contract symbol and press Enter on your keyboard.
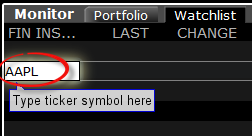
2. When then contract selection menu appears, select the item Stock (Directed). If you do not see this item, click on the small down arrow at the bottom of the menu to reveal the hidden menu items.
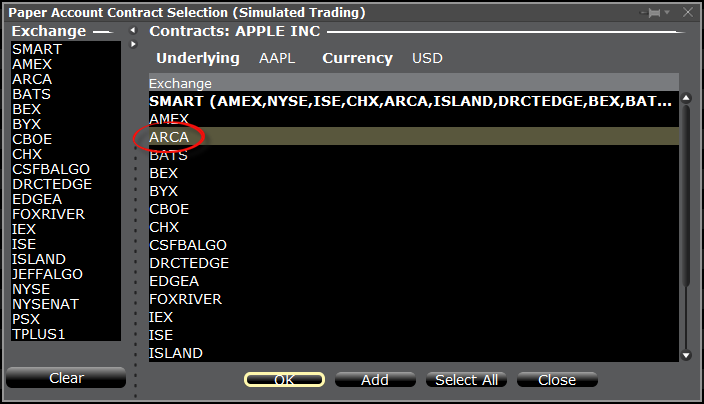
.png)
3. The Exchange selection screen will appear. You can now select the main Exchange for the product or the Exchange for which you have an active live market data subscription. Once done, click OK.
4. Within your watchlist you will see a newly created Directed Ticker line. It will contain the contract symbol and, preceded by the @ sign, the Exchange you selected at the previous step. Right click on that directed ticker line and select Chart > New Chart
5. The chart will be shown. On the left side of the toolbar, after the contract symbol, you will see the Exchange you selected preceeded by a @ sign, indicating that this is a Directed Chart.
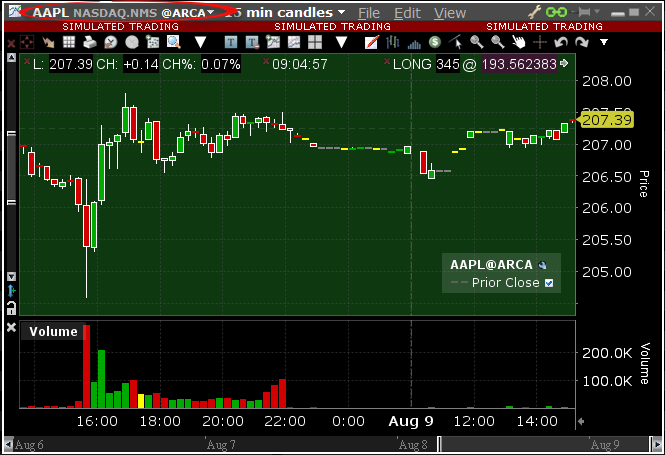
1. In order for the chart to update automatically, the checkbox "Keep chart up to date" has to be activated in the Chart Parameters panel. The panel is reachable directly within the chart window, from the top menu Edit.
2. Alternative streaming quotes for EU equities are available to clients with non-professional or non-commercial market data subscriber status. The complimentary real-time streaming Best Bid and Offer and last sale quotes on European Equities will be aggregated from exchanges such as Cboe Europe, Gettex, Tradegate and Turquoise. The data will display in the SMART quote line and can be used to generate a chart as well. Users who would like to receive the full EBBO (European Best Bid and Offer) will need to subscribe to the individual exchange subscriptions.
Delayed Market Data Timing
Overview:
Market data vendors typically offer exchange data in two categories, real-time and delayed. Real-time market data is disseminated as soon as the information is publicly available. Delayed market data is on a time lag that is usually 10-20 minutes behind real-time quotes.
Some exchanges allow delayed data to be displayed without any market data subscription, free of charge. A list of the exchanges we provide delayed data for at no cost and without formal request (i.e., the delayed data will be displayed upon entry of the product symbol on the trading platform) are outlined in the table below. The table also includes the corresponding real-time subscription, the fees for which are posted on IBKR's public website.
Please Note:
- In accordance with regulatory requirements, IBKR no longer offers delayed quotation information on U.S. equities to Interactive Brokers LLC clients.
- Delayed quotes should be used for indicative purposes and not necessarily for trading. The times mentioned may be subject to further delays without notice.
The Americas
| External Exchange Name | IB Exchange Name | Delay Period | Real Time Subscription |
| CBOT | CBOT | 10 minutes | CBOT Real-Time |
| CBOE Futures Exchange | CFE | 10 minutes | CFE Enhanced |
| Market Data Express (MDX) | CBOE | 10 minutes | CBOE Market Data Express Indices |
| CME | CME | 10 minutes | CME Real-Time |
| COMEX | COMEX | 10 minutes | COMEX Real-Time |
| ICE US | NYBOT | 10 minutes | ICE Futures U.S. (NYBOT) |
| Mexican Derivatives Exchange | MEXDER | 15 minutes | Mexican Derivatives Exchange |
| Mexican Stock Exchange | MEXI | 20 minutes | Mexican Stock Exchange |
| Montreal Exchange | CDE | 15 minutes | Montreal Exchange |
| NYMEX | NYMEX | 10 minutes | NYMEX Real-Time |
| NYSE GIF | NYSE | 15 minutes | NYSE Global Index Feed |
| One Chicago | ONE | 10 minutes | OneChicago |
| OPRA | OPRA | 15 minutes | OPRA Top of Book (L1) (US Option Exchanges) |
| OTC Markets | PINK | 15 minutes | OTC Markets |
| Toronto Stock Exchange | TSE | 15 minutes | Toronto Stock Exchange |
| Venture Exchange | VENTURE | 15 minutes | TSX Venture Exchange |
Europe
| External Exchange Name | IB Exchange Name | Delay Period | Real Time Subscription |
| BATS Europe | BATE/CHIX | 15 minutes | European (BATS/Chi-X) Equities |
| Boerse Stuttgart | SWB | 15 minutes | Stuttgart Boerse incl. Euwax (SWB) |
| Bolsa de Madrid | BM | 15 minutes | Bolsa de Madrid |
| Borsa Italiana | BVME/IDEM | 15 minutes | Borsa Italiana (BVME stock / SEDEX / IDEM deriv) |
| Budapest Stock Exchange | BUX | 15 minutes | Budapest Stock Exchange |
| Eurex | EUREX | 15 minutes | Eurex Real-Time Information |
| Euronext | AEB/SBF/MATIF/BELFOX | 15 minutes | Euronext Cash |
| Euronext | AEB/SBF/MATIF/BELFOX | 15 minutes | Euronext Data Bundle |
| Frankfurt Stock Exchange and XETRA | FWB/IBIS/XETRA | 15 minutes | Spot Market Germany (Frankfurt/Xetra) |
| ICE Futures Europe (Commodities) | IPE | 10 minutes | ICE Futures E.U. - Commodities (IPE) |
| ICE Futures Europe (Financials) | ICEEU | 10 minutes | ICE Futures E.U. – Financials (LIFFE) |
| LSE | LSE | 15 minutes | LSE UK |
| LSEIOB | LSEIOB | 15 minutes | LSE International |
| MEFF | MEFF | 15 minutes | BME (MEFF) |
| NASDAQ OMX Nordic Derivatives | OMS | 15 minutes | Nordic Derivatives |
| Prague Stock Exchange | PRA | 15 minutes | Prague Stock Exchange Cash Market |
| SWISS Exchange | EBS/VIRTX | 15 minutes | SIX Swiss Exchange |
| Tel Aviv Stock Exchange | TASE | 15 minutes | Tel Aviv Stock Exchange |
| Turquoise ECN | TRQXCH/TRQXDE/TRQXEN | 15 minutes | Turquoise ECNs |
| Warsaw Stock Exchange | WSE | 15 minutes | Warsaw Stock Exchange |
Asia
| External Exchange Name | IB Exchange Name | Delay Period | Real Time Subscription |
| Australian Stock Exchange | ASX | 20 minutes | ASX Total |
| Hang Seng Indices | HKFE-IND | 15 minutes | Hang Seng Indexes |
| Hong Kong Futures Exchange | HKFE | 15 minutes | Hong Kong Derivatives (Fut & Opt) |
| Hong Kong Stock Exchange | SEHK | 15 minutes | Hong Kong Securities Exchange (Stocks, Warrants & Bonds) |
| Korea Stock Exchange | KSE | 20 minutes | Korea Stock Exchange |
| National Stock Exchange of India | NSE | 15 minutes | National Stock Exchange of India, Capital Market Segment |
| Osaka Securities Exchange | OSE.JPN | 20 minutes | Osaka Exchange |
| SGX Derivatives | SGX | 10 minutes | Singapore Exchange (SGX) - Derivatives |
| Shanghai Stock Exchange | SEHKNTL | 15 minutes | Shanghai Stock Exchange |
| Shanghai Stock Exchange STAR Market | SEHKSTAR | 15 minutes | Shanghai Stock Exchange |
| Shenzhen Stock Exchange | SEHKSZSE | 15 minutes | Shenzhen Stock Exchange |
| Singapore Stock Exchange | SGX | 10 minutes | Singapore Exchange (SGX) - Stocks |
| Australia Securities Exchange | ASX24 | 10 minutes | ASX24 Commodities and Futures |
| Taiwan Stock Exchange | TWSE | 20 minutes | Taiwan Stock Exchange |
| Tokyo Stock Exchange | TSEJ | 20 minutes | Tokyo Stock Exchange |
Risk Navigator: Alternative Margin Calculator
Overview:
IB routinely reviews margin levels and will implement changes which serve to increase requirements above statutory minimums as market conditions warrant. To assist clients with understanding the effects of such changes on their portfolio, a feature referred to as the "Alternative Margin Calculator" is provided within the Risk Navigator application. Outlined below are the steps for creating a “what-if” portfolio for the purpose of determining the impact of such margin changes.
Step 1: Open a new “What-if” portfolio
From the Classic TWS trading platform, select the Analytical Tools, Risk Navigator, and then Open New What-If menu options (Exhibit1).
Exhibit 1
.png)
From the Mosaic TWS trading platform, select New Window, Risk Navigator, and then Open New What-If menu options.
Step 2: Define starting portfolio
A pop-up window will appear (Exhibit 2) from which you will be prompted to define whether you would like to create a hypothetical portfolio starting from your current portfolio or a newly created portfolio. Clicking on the "yes" button will serve to download existing positions to the new “What-If” portfolio.
Exhibit 2
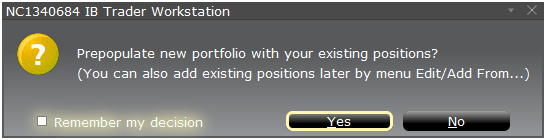
Clicking on the "No" button will open up the “What – If” Portfolio with no positions.
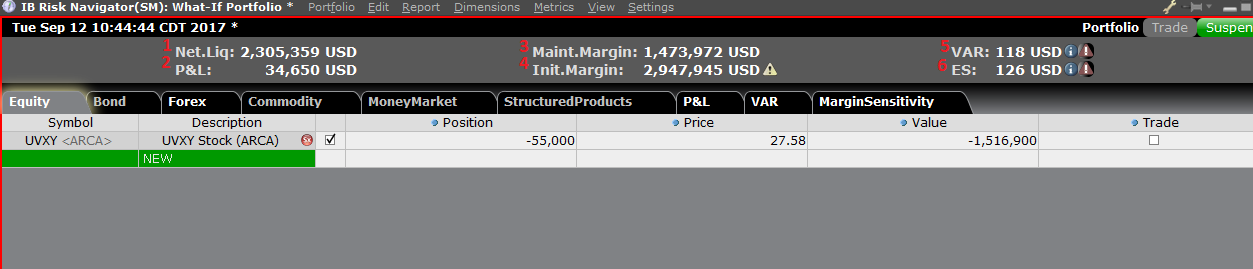
Risk Dashboard
The Risk Dashboard is pinned along the top of the product tab-sets, and is and is available for what-if as well as active portfolios. The values are calculated on demand for what-if portfolios. The dashboard provides at-a-glance account information including:
1) Net Liquidation Value: The total Net Liquidation Value for the account
2) P&L: The total daily P&L for the entire portfolio
3) Maintenance Margin: Total current maintenance margin
4) Initial Margin: Total initial margin requirements
5) VAR: Shows the Value at risk for the entire portfolio
6) Expected Shortfall (ES): Expected Shortfall (average value at risk) is expected return of the portfolio in the worst case
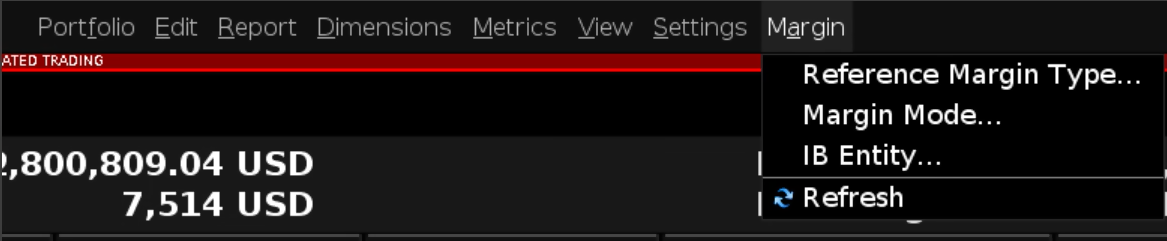
Alternative Margin Calculator
The Alternative Margin Calculator, accessed from the Margin menu and clicking on the Margin Mode (Exhibit 3), shows how the margin change will affect the overall margin requirement, once fully implemented.
Exhibit 3
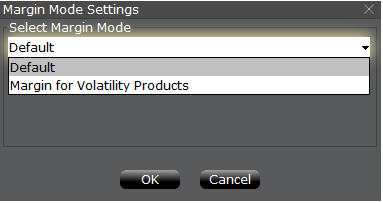
Step 3: Selecting Margin Mode Settings
A pop-up window will appear (Exhibit 4) entitled Margin Mode Setting. You can use the drop-down menu in that window to change the margin calculations from Default (being the current policy) to the new title of the new Margin Setting (being the new margin policy). Once you have made a selection click on the OK button in that window.
Exhibit 4
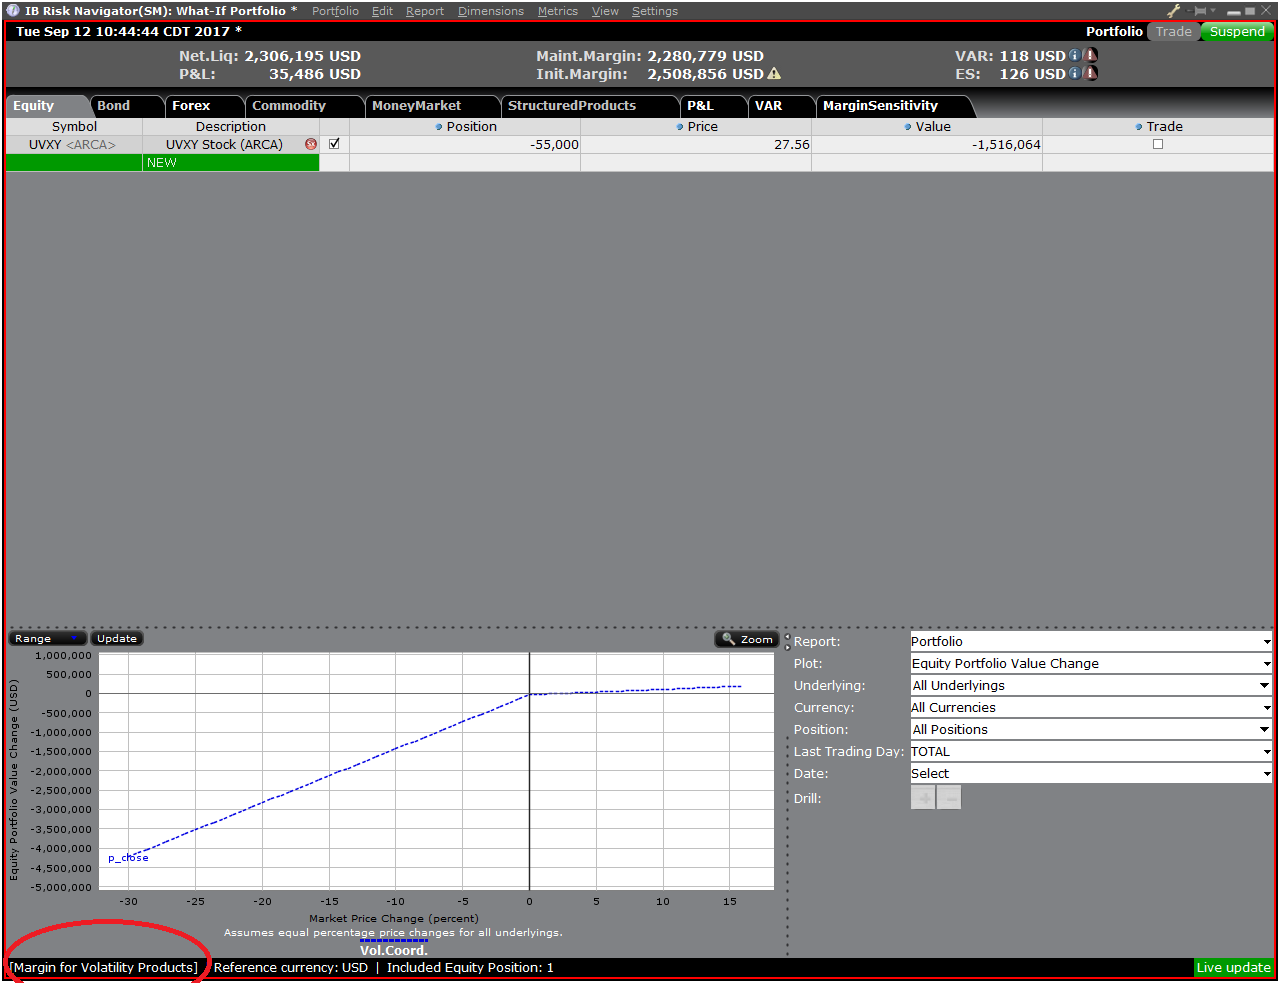
Once the new margin mode setting is specified, the Risk Navigator Dashboard will automatically update to reflect your choice. You can toggle back and forth between the Margin Mode settings. Note that the current Margin Mode will be shown in the lower left hand corner of the Risk Navigator window (Exhibit 5).
Exhibit 5
Step 4: Add Positions
To add a position to the "What - If" portfolio, click on the green row titled "New" and then enter the underlying symbol (Exhibit 6), define the product type (Exhibit 7) and enter position quantity (Exhibit 8)
Exhibit 6
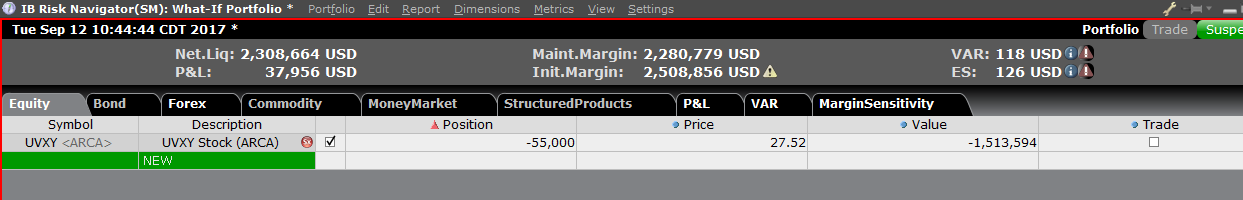
Exhibit 7
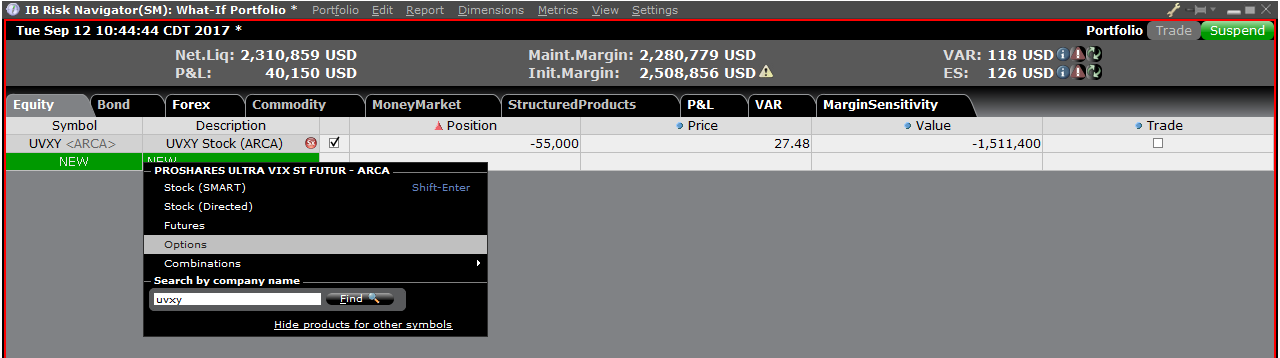
Exhibit 8
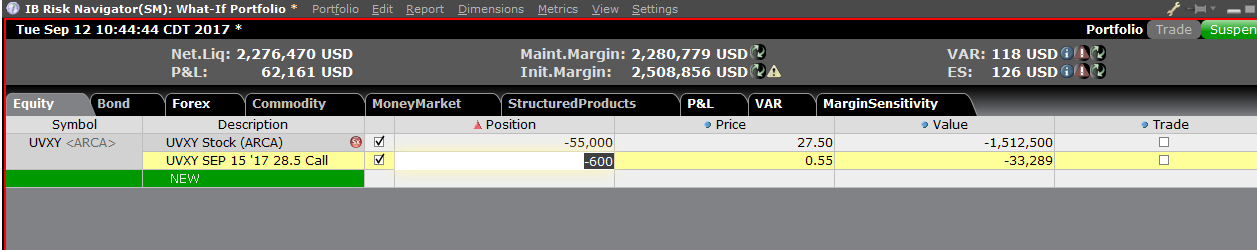
You can modify the positions to see how that changes the margin. After you altered your positions you will need to click on the recalculate icon (![]() ) to the right of the margin numbers in order to have them update. Whenever that icon is present the margin numbers are not up-to-date with the content of the What-If Portfolio.
) to the right of the margin numbers in order to have them update. Whenever that icon is present the margin numbers are not up-to-date with the content of the What-If Portfolio.