Allocation of Partial Fills
How are executions allocated when an order receives a partial fill because an insufficient quantity is available to complete the allocation of shares/contracts to sub-accounts?
Overview:
From time-to-time, one may experience an allocation order which is partially executed and is canceled prior to being completed (i.e. market closes, contract expires, halts due to news, prices move in an unfavorable direction, etc.). In such cases, IB determines which customers (who were originally included in the order group and/or profile) will receive the executed shares/contracts. The methodology used by IB to impartially determine who receives the shares/contacts in the event of a partial fill is described in this article.
Background:
Before placing an order CTAs and FAs are given the ability to predetermine the method by which an execution is to be allocated amongst client accounts. They can do so by first creating a group (i.e. ratio/percentage) or profile (i.e. specific amount) wherein a distinct number of shares/contracts are specified per client account (i.e. pre-trade allocation). These amounts can be prearranged based on certain account values including the clients’ Net Liquidation Total, Available Equity, etc., or indicated prior to the order execution using Ratios, Percentages, etc. Each group and/or profile is generally created with the assumption that the order will be executed in full. However, as we will see, this is not always the case. Therefore, we are providing examples that describe and demonstrate the process used to allocate partial executions with pre-defined groups and/or profiles and how the allocations are determined.
Here is the list of allocation methods with brief descriptions about how they work.
· AvailableEquity
Use sub account’ available equality value as ratio.
· NetLiq
Use subaccount’ net liquidation value as ratio
· EqualQuantity
Same ratio for each account
· PctChange1:Portion of the allocation logic is in Trader Workstation (the initial calculation of the desired quantities per account).
· Profile
The ratio is prescribed by the user
· Inline Profile
The ratio is prescribed by the user.
· Model1:
Roughly speaking, we use each account NLV in the model as the desired ratio. It is possible to dynamically add (invest) or remove (divest) accounts to/from a model, which can change allocation of the existing orders.
Basic Examples:
Details:
CTA/FA has 3-clients with a predefined profile titled “XYZ commodities” for orders of 50 contracts which (upon execution) are allocated as follows:
Account (A) = 25 contracts
Account (B) = 15 contracts
Account (C) = 10 contracts
Example #1:
CTA/FA creates a DAY order to buy 50 Sept 2016 XYZ future contracts and specifies “XYZ commodities” as the predefined allocation profile. Upon transmission at 10 am (ET) the order begins to execute2but in very small portions and over a very long period of time. At 2 pm (ET) the order is canceled prior to being executed in full. As a result, only a portion of the order is filled (i.e., 7 of the 50 contracts are filled or 14%). For each account the system initially allocates by rounding fractional amounts down to whole numbers:
Account (A) = 14% of 25 = 3.5 rounded down to 3
Account (B) = 14% of 15 = 2.1 rounded down to 2
Account (C) = 14% of 10 = 1.4 rounded down to 1
To Summarize:
A: initially receives 3 contracts, which is 3/25 of desired (fill ratio = 0.12)
B: initially receives 2 contracts, which is 2/15 of desired (fill ratio = 0.134)
C: initially receives 1 contract, which is 1/10 of desired (fill ratio = 0.10)
The system then allocates the next (and final) contract to an account with the smallest ratio (i.e. Account C which currently has a ratio of 0.10).
A: final allocation of 3 contracts, which is 3/25 of desired (fill ratio = 0.12)
B: final allocation of 2 contracts, which is 2/15 of desired (fill ratio = 0.134)
C: final allocation of 2 contract, which is 2/10 of desired (fill ratio = 0.20)
The execution(s) received have now been allocated in full.
Example #2:
CTA/FA creates a DAY order to buy 50 Sept 2016 XYZ future contracts and specifies “XYZ commodities” as the predefined allocation profile. Upon transmission at 11 am (ET) the order begins to be filled3 but in very small portions and over a very long period of time. At 1 pm (ET) the order is canceled prior being executed in full. As a result, only a portion of the order is executed (i.e., 5 of the 50 contracts are filled or 10%).For each account, the system initially allocates by rounding fractional amounts down to whole numbers:
Account (A) = 10% of 25 = 2.5 rounded down to 2
Account (B) = 10% of 15 = 1.5 rounded down to 1
Account (C) = 10% of 10 = 1 (no rounding necessary)
To Summarize:
A: initially receives 2 contracts, which is 2/25 of desired (fill ratio = 0.08)
B: initially receives 1 contract, which is 1/15 of desired (fill ratio = 0.067)
C: initially receives 1 contract, which is 1/10 of desired (fill ratio = 0.10)
The system then allocates the next (and final) contract to an account with the smallest ratio (i.e. to Account B which currently has a ratio of 0.067).
A: final allocation of 2 contracts, which is 2/25 of desired (fill ratio = 0.08)
B: final allocation of 2 contracts, which is 2/15 of desired (fill ratio = 0.134)
C: final allocation of 1 contract, which is 1/10 of desired (fill ratio = 0.10)
The execution(s) received have now been allocated in full.
Example #3:
CTA/FA creates a DAY order to buy 50 Sept 2016 XYZ future contracts and specifies “XYZ commodities” as the predefined allocation profile. Upon transmission at 11 am (ET) the order begins to be executed2 but in very small portions and over a very long period of time. At 12 pm (ET) the order is canceled prior to being executed in full. As a result, only a portion of the order is filled (i.e., 3 of the 50 contracts are filled or 6%). Normally the system initially allocates by rounding fractional amounts down to whole numbers, however for a fill size of less than 4 shares/contracts, IB first allocates based on the following random allocation methodology.
In this case, since the fill size is 3, we skip the rounding fractional amounts down.
For the first share/contract, all A, B and C have the same initial fill ratio and fill quantity, so we randomly pick an account and allocate this share/contract. The system randomly chose account A for allocation of the first share/contract.
To Summarize3:
A: initially receives 1 contract, which is 1/25 of desired (fill ratio = 0.04)
B: initially receives 0 contracts, which is 0/15 of desired (fill ratio = 0.00)
C: initially receives 0 contracts, which is 0/10 of desired (fill ratio = 0.00)
Next, the system will perform a random allocation amongst the remaining accounts (in this case accounts B & C, each with an equal probability) to determine who will receive the next share/contract.
The system randomly chose account B for allocation of the second share/contract.
A: 1 contract, which is 1/25 of desired (fill ratio = 0.04)
B: 1 contract, which is 1/15 of desired (fill ratio = 0.067)
C: 0 contracts, which is 0/10 of desired (fill ratio = 0.00)
The system then allocates the final [3] share/contract to an account(s) with the smallest ratio (i.e. Account C which currently has a ratio of 0.00).
A: final allocation of 1 contract, which is 1/25 of desired (fill ratio = 0.04)
B: final allocation of 1 contract, which is 1/15 of desired (fill ratio = 0.067)
C: final allocation of 1 contract, which is 1/10 of desired (fill ratio = 0.10)
The execution(s) received have now been allocated in full.
Available allocation Flags
Besides the allocation methods above, user can choose the following flags, which also influence the allocation:
· Strict per-account allocation.
For the initially submitted order if one or more subaccounts are rejected by the credit checking, we reject the whole order.
· “Close positions first”1.This is the default handling mode for all orders which close a position (whether or not they are also opening position on the other side or not). The calculation are slightly different and ensure that we do not start opening position for one account if another account still has a position to close, except in few more complex cases.
Other factor affects allocations:
1) Mutual Fund: the allocation has two steps. The first execution report is received before market open. We allocate based onMonetaryValue for buy order and MonetaryValueShares for sell order. Later, when second execution report which has the NetAssetValue comes, we do the final allocation based on first allocation report.
2) Allocate in Lot Size: if a user chooses (thru account config) to prefer whole-lot allocations for stocks, the calculations are more complex and will be described in the next version of this document.
3) Combo allocation1: we allocate combo trades as a unit, resulting in slightly different calculations.
4) Long/short split1: applied to orders for stocks, warrants or structured products. When allocating long sell orders, we only allocate to accounts which have long position: resulting in calculations being more complex.
5) For non-guaranteed smart combo: we do allocation by each leg instead of combo.
6) In case of trade bust or correction1: the allocations are adjusted using more complex logic.
7) Account exclusion1: Some subaccounts could be excluded from allocation for the following reasons, no trading permission, employee restriction, broker restriction, RejectIfOpening, prop account restrictions, dynamic size violation, MoneyMarketRules restriction for mutual fund. We do not allocate to excluded accountsand we cancel the order after other accounts are filled. In case of partial restriction (e.g. account is permitted to close but not to open, or account has enough excess liquidity only for a portion of the desired position).
Footnotes:
Order Preview - Check Exposure Fee Impact
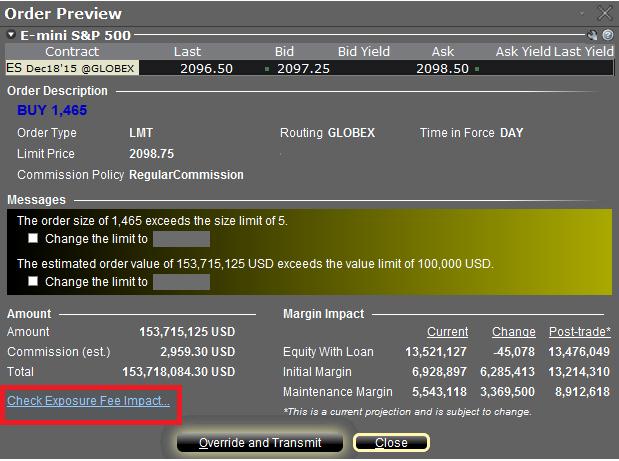
IB provides a feature which allows account holders to check what impact, if any, an order will have upon the projected Exposure Fee. The feature is intended to be used prior to submitting the order to provide advance notice as to the fee and allow for changes to be made to the order prior to submission in order to minimize or eliminate the fee.
The feature is enabled by right-clicking on the order line at which point the Order Preview window will open. This window will contain a link titled "Check Exposure Fee Impact" (see red highlighted box in Exhibit I below).
Exhibit I
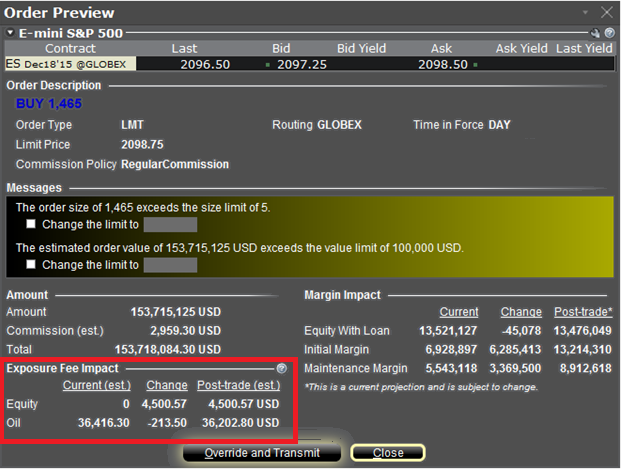
Clicking the link will expand the window and display the Exposure fee, if any, associated with the current positions, the change in the fee were the order to be executed, and the total resultant fee upon order execution (see red highlighted box in Exhibit II below). These balances are further broken down by the product classification to which the fee applies (e.g. Equity, Oil). Account holders may simply close the window without transmitting the order if the fee impact is determined to be excessive.
Exhibit II
Please see KB2275 for information regarding the use of IB's Risk Navigator for managing and projecting the Exposure Fee and KB2344 for monitoring fees through the Account Window
Important Notes
1. The Estimated Next Exposure Fee is a projection based upon readily available information. As the fee calculation is based upon information (e.g., prices and implied volatility factors) available only after the close, the actual fee may differ from that of the projection.
2. The Check Exposure Fee Impact is only available for accounts that have been charged an exposure fee in the last 30 days
Welcome to Interactive Brokers
Overview:
Now that your account is funded and approved you can start trading. The information below will help you getting
started as a new customer of Interactive Brokers.
- Your Money
- Configure your account to trade
- How to trade
- Trade all over the World
- Five points to enrich your IB experience
1. Your Money
Deposits & Withdrawals General Info. All transactions are administered through your secure Account Management
Deposits
First, you create a deposit notification through your Account Management > Funding > Fund Transfers > Transaction Type: “Deposit” How to create a deposit notification. The second step is to instruct your Bank to do the wire transfer with the bank details provided in your Deposit Notification.
Withdrawals
Create a withdrawal instruction via your secure Account Management > Funding > Fund Transfers > Transaction Type: "Withdrawals" How to create a withdrawal instruction
If you instruct a withdrawal over the Withdrawal limits, it will be considered an exceptional withdrawal and we will therefore need to match bank account holder and IB account. If destination bank account has been used for a deposit, withdrawal will be processed; otherwise, you must contact customer service and provide the documents needed.
Troubleshooting
Deposits: My bank sent the money but I do not see it credited into my IB account. Possible reasons:
a) A fund transfer takes 1-4 business days
b) A Deposit Notification is missing. You have to create it via your Account Management and send a ticket to Customer Service
c) Amending details are missing. Your name or IB account number is missing in the transfer details. You have to contact your bank and ask for the full amending details.
d) ACH initiated by IB is limited to 100k USD in a 7 business period. If you opened a Portfolio Margin account where the initial requirement is 110k, a wire deposit might be the better deposit option to reduce wait time for your first trade. If selecting ACH a wait time of almost 2 weeks or a temporary downgrade to RegT can be possible solutions.
Withdrawals: I have requested a withdrawal but I do not see the money credited to my bank account. Possible reasons:
a) A fund transfer takes 1-4 business days
b) Rejected. Over the max it can be withdrawn. Please check your account cash balance. Note that for regulatory requirements, when the funds are deposited, there is a 3 day holding period before they can be withdrawn.
c) Your bank returned the funds. Probably because receiving bank account and remitting bank account names do not match.
2. Configure your account to trade
Difference between Cash and Margin accounts: If you have chosen the FastTrack application, by default your account type is a cash account with US stock permission. If you would like to get leverage and trade on margin, here how to upgrade to a RegT Margin account
Trading Permissions
In order to be able to trade a particular asset class in a particular country, you need to get the trading permission for it via your Account Management. Please note that trading permissions are free. You might however be asked to sign risk
disclosures required by local regulatory authorities. How to Request Trading Permissions
Market Data
If you want to have market data in real-time for a particular product/exchange, you need to subscribe to a market data package charged by the exchange. How to subscribe to Market data
The Market data assistant will help you choose the right package. Please watch this Video explaining how it works.
Customers have the option to receive delayed market data for free by clicking the Free Delayed Data button from a non-subscribed ticker row.
Advisor Accounts
Have a look at the user guide getting started as advisors. Here you see how to create additional users to your advisor account and grant them access and much more.
3. How to trade
The Trader's University is the place to go when you want to learn how to use our Platforms. Here you will find our webinars, live and recorded in 10 languages and tours and documentation about our various Trading Platforms.
Trader Workstation (TWS)
Traders who require more sophisticated trading tools can use our market maker-designed Trader Workstation (TWS), which optimizes your trading speed and efficiency with an easy-to-use spreadsheet interface, support for more than 60 order types, task-specific trading tools for all trading styles, and real-time account balance and activity monitoring. Try the two models
TWS Mosaic: for intuitive usability, easy trading access, order management, watchlist, charts all in one window or
TWS Classic: the Advanced Order Management for traders who need more advanced tools and algos.
General Description and Information / Quick start guide / Usersguide
Interactive Tours: TWS Basics / TWS configuration / TWS Mosaic
How to place a trade: Video Classic TWS / Video Mosaic
Trading tools: General Description and Information / Users guide
Requirements: How to install Java for Windows / How to install Java for MAC / Port 4000 and 4001 needs to be open
Login TWS / Download TWS
WebTrader
Traders who prefer a clean and simple interface can use our HTML-based WebTrader, which makes it easy to view market data, submit orders, and monitor your account and executions. Use the latest WebTrader from every browser
Quick Start Guide / WebTrader User's Guide
Introduction: Video WebTrader
How to place a Trade: Video WebTrader
Login WebTrader
MobileTrader
Our mobile solutions allow you to trade your IB account on the go. The mobileTWS for iOS and the mobileTWS for BlackBerry are custom-designed for these popular models, while the generic MobileTrader supports most other Smart phones.
General Description and Information
Order Types Order Types available and Description / Videos / Tour / Users guide
Paper Trading General Description and Information / How to get a Paper Trading Account
Once your paper account is created, you can share the market data of your real account with your paper trading account: Account Management > Manage Account > Settings > Paper trading
4. Trade all over the World
IB accounts are multi-currency accounts. Your account can hold different currencies at the same time, this allows you to trade multiple products around the world from a single account.
Base Currency
Your base currency determines the currency of translation for your statements and the currency used for determining margin requirements. Base currency is determined when you open an account. Customers may change their base currency at any time through Account Management.
We do not automatically convert currencies into your Base currency
Currency conversions must be done manually by the customer. In this video you can learn how to do a currency conversion.
In order to open a position denominated in a currency that you do not have in your account, you have two possibilities:
A) Currency conversion.
B) IB Margin Loan. (Not available for Cash Accounts)
Please see this course explaining the mechanics of a foreign transaction.
5. Five points to enrich your IB experience
1. Contract Search
Here you will find all our products, symbols and specifications.
2. IB Knowledge Base
The Knowledge Base is a repository of glossary terms, how-to articles, troubleshooting tips and guidelines designed to assist IB customers with the management of their IB accounts. Just enter in the search button what you are looking for and you will get the answer.
3. Account Management
As our trading platforms give you access to the markets, the Account Management grants you access to your IB account. Use Account Management to manage account-related tasks such as depositing or withdrawing funds, viewing your statements, modifying market data and news subscriptions, changing your trading permissions, and verifying or changing your personal information.
Log In Account Management / AM Quick Start Guide / AM Users Guide
4. Secure Login System
To provide you with the highest level of online security, Interactive Brokers has implemented a Secure Login System (SLS) through which access to your account is subject to two-factor authentication. Two-factor authentication serves to confirm your identity at the point of login using two security factors: 1) Something you know (your username and password combination); and 2) Something you have (an IB issued security device which generates a random, single-use security code). As both knowledge of your username/password and physical possession of the security device are required to login to your account, participation in the Secure Login System virtually eliminates the possibility of anyone other than you accessing your account.
How to Activate your Security Device / How to Obtain a Security Code Card / How to return Security device
In case you forgot your password or lost your security code card, please call us for immediate assistance.
5. Statements and Reports
Easy to view and customize, our statements and reports cover all aspects of your Interactive Brokers account. How to view an Activity Statement
Overview of Margin Methodologies
Introduction
The methodology used to calculate the margin requirement for a given position is largely determined by the following three factors:
1. The product type;
2. The rules of the exchange on which the product is listed and/or the primary regulator of the carrying broker;
3. IBKR’s “house” requirements.
While a number of methodologies exist, they tend to be categorized into one of two approaches: rules based or risk based. Rules based methods generally assume uniform margin rates across like products, offer no inter-product offsets and consider derivative instruments in a manner similar to that of their underlying. In this sense, they offer ease of computation but oftentimes make assumptions which, while simple to execute, may overstate or understate the risk of an instrument relative to its historic performance. A common example of a rules based methodology is the U.S. based Reg. T requirement.
In contrast, risk based methodologies often seek to apply margin coverage reflective of the product’s past performance, recognize some inter-product offsets and seek to model the non-linear risk of derivative products using mathematical pricing models. These methodologies, while intuitive, involve computations which may not be easily replicable by the client. Moreover, to the extent that their inputs rely upon observed market behavior, may result in requirements that are subject to rapid and sizable fluctuation. Examples of risk based methodologies include TIMS and SPAN.
Regardless of whether the methodology is rules or risk based, most brokers will apply “house” margin requirements which serve to increase the statutory, or base, requirement in targeted instances where the broker’s view of exposure is greater than that which would satisfied solely by meeting that base requirement. An overview of the most common risk and rules based methodologies is provided below.
Methodology Overview
Risk Based
a. Portfolio Margin (TIMS) – The Theoretical Intermarket Margin System, or TIMS, is a risk based methodology created by the Options Clearing Corporation (OCC) which computes the value of the portfolio given a series of hypothetical market scenarios where price changes are assumed and positions revalued. The methodology uses an option pricing model to revalue options and the OCC scenarios are augmented by a number of house scenarios which serve to capture additional risks such as extreme market moves, concentrated positions and shifts in option implied volatilities. In addition, there are certain securities (e.g., Pink Sheet, OTCBB and low cap) for which margin may not be extended. Once the projected portfolio values are determined at each scenario, the one which projects the greatest loss is the margin requirement.
Positions to which the TIMS methodology is eligible to be applied include U.S. stocks, ETFs, options, single stock futures and Non U.S. stocks and options which meet the SEC’s ready market test.
As this methodology uses a much more complex set of computations than one that is rules based, it tends to more accurately model risk and generally offers greater leverage. Given its ability to offer enhanced leverage and that the requirements fluctuate and may react quickly to changing market conditions, it is intended for sophisticated individuals and requires minimum equity of $110,000 to initiate and $100,000 to maintain. Requirements for stocks under this methodology generally range from 15% to 30% with the more favorable requirement applied to portfolios which contain a highly diversified group of stocks which have historically exhibited low volatility and which tend to employ option hedges.
b. SPAN – Standard Portfolio Analysis of Risk, or SPAN, is a risk-based margin methodology created by the Chicago Mercantile Exchange (CME) that is designed for futures and future options. Similar to TIMS, SPAN determines a margin requirement by calculating the value of the portfolio given a set of hypothetical market scenarios where underlying price changes and option implied volatilities are assumed to change. Again, IBKR will include in these assumptions house scenarios which account for extreme price moves along with the particular impact such moves may have upon deep out-of-the-money options. The scenario which projects the greatest loss becomes the margin requirement. A detailed overview of the SPAN margining system is provided in KB563.
Rules Based
a. Reg. T – The U.S. central bank, the Federal Reserve Board, holds responsibility for maintaining the stability of the financial system and containing systemic risk that may arise in financial markets. It does this, in part, by governing the amount of credit that broker dealers may extend to customers who borrow money to buy securities on margin.
This is accomplished through Regulation T, or Reg. T as it is commonly referred, which provides for establishment of a margin account and which imposes the initial margin requirement and payment rules on certain securities transactions. For example, on stock purchases, Reg. T currently requires an initial margin deposit by the client equal to 50% of the purchase value, allowing the broker to extend credit or finance the remaining 50%. For example, an account holder purchasing $1,000 worth of securities is required to deposit $500 and allowed to borrow $500 to hold those securities.
Reg. T only establishes the initial margin requirement and the maintenance requirement, the amount necessary to continue holding the position once initiated, is set by exchange rule (25% for stocks). Reg. T also does not establish margin requirements for securities options as this falls under the jurisdiction of the listing exchange’s rules which are subject to SEC approval. Options held in a Reg.T account are also subject to a rules based methodology where short positions are treated like a stock equivalent and margin relief is provided for spread transactions. Finally, positions held in a qualifying portfolio margin account are exempt from the requirements of Reg. T.
Where to Learn More
Tools provided to monitor and manage margin
How to determine if you are borrowing funds from IBKR
Why does IBKR calculate and report a margin requirement when I am not borrowing funds?
Margin Treatment for Foreign Stocks Carried by a U.S. Broker
As a U.S. broker-dealer registered with the Securities & Exchange Commission (SEC) for the purpose of facilitating customer securities transactions, IB LLC is subject to various regulations relating to the extension of credit and margining of those transactions. In the case of foreign equity securities (i.e., non-U.S. issuer), Reg T. allows a U.S. broker to extend margin credit to those which either appear on the Federal Reserve Board's periodically published List of Foreign Margin Stocks, or are deemed to have a have a "ready market" under SEC Rule 15c3-1 or SEC no-action letter.
Prior to November 2012, "ready market" was deemed to include equity securities of a foreign issuer that are listed on what is now known as the FTSE World Index. This definition was based upon a 1993 SEC no-action letter and was premised upon the fact that, while there may not have been a ready market for such securities within the U.S., the securities could be readily resold in the applicable foreign market. In November of 2012, the SEC issued a follow-up no-action letter (www.sec.gov/divisions/marketreg/mr-noaction/2012/finra-112812.pdf) which expanded the population of foreign equity securities deemed to have a ready market to also include those not listed on the FTSE World Index provided that the following four conditions are met:
1. The security is listed on a foreign exchange located within a FTSE World Index recognized country, where the security has been trading on the exchange for at least 90 days;
2. Daily bid, ask and last quotations for the security as provided by the foreign listing exchange are made continuously available to the U.S. broker through an electronic quote system;
3. The median daily trading volume calculated over the preceding 20 business day period of the security on its listing exchange is either at least 100,000 shares or $500,000 (excluding shares purchased by the computing broker);
4. The aggregate unrestricted market capitalization in shares of the security exceed $500 million over each of the preceding 10 business days.
Note: if a security previously meeting the above conditions no longer does so, the broker is provided with a 5 business day window after which time the security will no longer be deemed readily marketable and must be treated as non-marginable.
Foreign equity securities which do not meet the above conditions, will be treated as non-marginable and will therefore have no loan value. Note that for purposes of this no-action letter foreign equity securities do not include options.
Key Margin Definitions
Overview:
Below is a listing of some of the more commonly used margin terms:
Equity with Loan Value (ELV) – Forms the basis for determining whether a client has the necessary assets to either initiate or maintain security positions. Equals cash + stock value + bond value + mutual fund value + European and Asian options value (excludes market value U.S. securities & futures options and cash maintained in futures segment).
Available Funds (ELV – Initial Margin) – equals Equity with Loan Value less the Initial Margin Requirement.
Excess Liquidity (ELV – Maintenance Margin) – equals Equity with Loan Value less the Maintenance Margin Requirement.
Initial Margin Requirement - The minimum portion of a new security purchase that an investor must pay for in cash. For U.S. stocks this is defined by Reg. T and is currently 50% (Reg. T Initial Margin). As IB calculates margin on a real-time basis and Reg. T is enforced at the end of the day, IB performs an initial margin requirement check at the point of trade, albeit at a rate generally less than 50% (IB Initial Margin).
Maintenance Margin Requirement – the amount of equity which must be maintained in order to continue holding a position. In the U.S., the rules of the listing exchanges specify the maintenance margin requirements on security transactions subject to SEC approval. The exchange maintenance margin requirement for long stock positions is currently set at 25% although brokers often establish 'house margin' requirements in excess of that, particularly where the security is considered low-priced or subject to volatile price changes. The exchange maintenance margin requirement for short stock positions is currently set at 30%.
Net Liquidating Value (NLV) – for a securities account equals total cash value + stock value + securities options value + bond value + fund value. For a commodities account equals total cash value + commodities options value.
Soft Edge Margin (SEM) – if during the trading day an account’s Equity with Loan Value is equal to at least 90% of the maintenance margin requirement, it will not be subject to liquidation until 15:45 ET for U.S. stocks (i.e., the earliest of: 15 minutes before market close, 15 minutes before end of liquidation hours or start of Reg. T enforcement time) at which time the maintenance margin requirement must be met. SEM start time for U.S. stocks is 09:30 ET and for other products the later of: the market open (latest open time if multiply listed); or start of liquidation hours.
Buying Power - the maximum dollar value of securities that you can buy in your account without depositing additional equity. For a cash account this is equal to the lesser of ELV or Previous Day ELV less the Initial Margin Requirement. For a margin account this is equal to Available Funds * 4 (reciprocal of the 25% Maintenance Margin Rate)
Special Memorandum Account (SMA) – represents neither equity nor cash but rather a line of credit created when the market value of securities in a Reg. T margin account increase in value. While an increase in market value over original cost creates SMA, a subsequent decline in market value has no effect on SMA. SMA will only decline if used to purchase securities or withdraw cash and the only restriction with respect to its use is that the additional purchases or withdrawals do not bring the account below the maintenance margin requirement. SMA will also increase on a dollar for dollar basis in the event of cash deposits or dividends.
Securities Gross Position Value (GPV) – Absolute value of Long Stock Value + Short Stock Value + Long Option Value + Short Option Value + Long SSF Notional Value + Short SSF Notional Value + Fund Value.
Will IBKR delay liquidation while I deposit funds in my account?
Overview:
IBKR's margin compliance policy does not allow for transfers or other deposits if there is a margin violation/deficit in the account. In the case of a margin violation/deficit, the account in deficit is immediately subject to liquidation. Automated liquidations are accomplished with market orders, and any/all positions in the account can be liquidated. There are cases where, due to specific market conditions, a deficit is better addressed via a manual liquidation.
Funds deposited or wired into the account are not taken into consideration from a risk standpoint until those funds have cleared all the appropriate funds and banking channels and are officially in the account. The liquidation system is automated and programmed to act immediately if there is a margin violation/deficit.
Note for Prime Clients: Executing away is not a means to resolve real time deficits as away trades will not be taken into consideration for beneficial margin purposes until 9 pm ET on Trade Date or when the trades have been reported and matched with external confirms, whichever is later. Trading away for expiring options, on expiration day, is also discouraged due to the potential for late or inaccurate reporting which can lead to erroneous margin calculations or incorrect exercise and assignment activity. Clients who wish to trade expiring options on expiration day and away from IB, must load their FTP file no later than 2:50 pm ET, and do so at their own risk.
What formulas do you use to calculate the margin on options?
Overview:
There are many different formulas used to calculate the margin requirement on options. Which formula is used will depend on the option type or strategy determined by the system. There are a significant number of detailed formulas that are applied to various strategies. To find this information go to the IBKR home page at www.interactivebrokers.com. Go to the Trading menu and click on Margin. From the Margin Requirements page, click on the Options tab. There is a table on this page which will list all possible strategies, and the various formulas used to calculate margin on each.
Background:
The information above applies to equity options and index options. Options on futures employ an entirely different method known as SPAN margining. For information on SPAN margining, conduct a search on this page for “SPAN” or “Futures options margin”.
When I sell stock, how much does it increase SMA?
Overview:
When an account holder sells a marginable security, it will typically increase their SMA by 50% of the value of the security sold.